On the Dashboard tab of the home page, Veeam Backup Enterprise Manager displays on-going data for two time periods — data collected for the last day and data collected for the last week. To switch between these views, click the Last 24 hours or Last 7 days correspondingly. The following information will be displayed:
- The Summary block shows the total number of managed backup servers, performed jobs, processed machines and virtual machine templates.
- The Data block shows the average processing speed, total sizes of processed machines, full backups and increments.
- The Last 24 hours/Last 7 days block shows the total number of job runs, jobs completed successfully, completed with warnings and failed jobs.
- The Status block shows the status of backup files, managed backup servers, Veeam Backup Enterprise Manager management server, and licenses. License status is displayed as follows:
- Success – valid current license
- Warning – working in grace period or failed to update license
- Error – license expired and grace period is over

You can use the links in these blocks to drill down into detailed reports on specific aspects of the backup infrastructure.
To visualize on-going jobs data, Veeam Backup Enterprise Manager uses graphs showing time and date when jobs were performed, and the network throughput rate during the job. Jobs related to one backup server are marked with a separate color on the graph. The legend on the right interprets the color scheme used for all managed backup servers. The highlighted part of the graph represents the configured backup window (if specified in the dashboard settings).

Customizing Dashboard Appearance
If required, you can customize the appearance of graphs in the main Veeam Backup Enterprise Manager view. Do the following:
- Open the Configuration view.
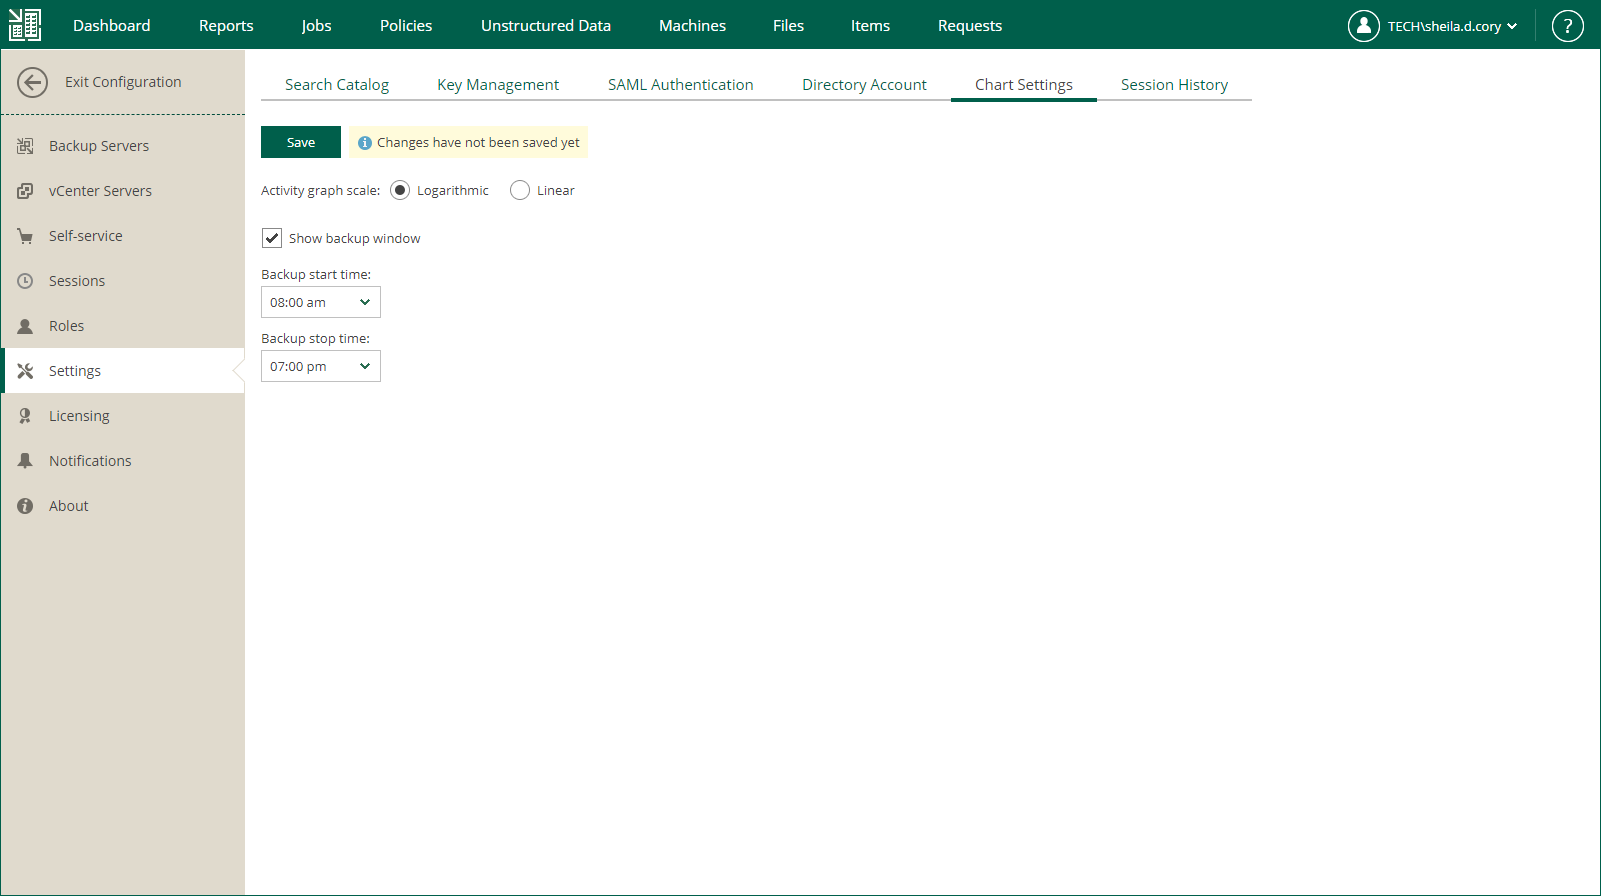
- Click the Settings tab on the left of the Configuration view.
- Use the Activity graph scale options in the Chart Settings section to switch between graph types: Linear and Logarithmic.
- By default, the time interval specified under the selected Show backup window check box is highlighted on the activity graph. Default interval is from 8:00 PM to 8:00 AM. You can change the highlighted interval to correlate with your planned backup window by editing the start and stop time. If you do not want to highlight the backup window on the graph, clear the Show backup window check box.
- Save the changes.