 This is an archive version of the document. To get the most up-to-date information, see the current version.
Viewing Offload Job Session Results
To review the offload session results, do the following:
- Switch to the History view.
- In the inventory pane, select the System node.
- In the preview pane, right-click the offload session and select Statistics.
For more information about the offload job, see Data Transfer.
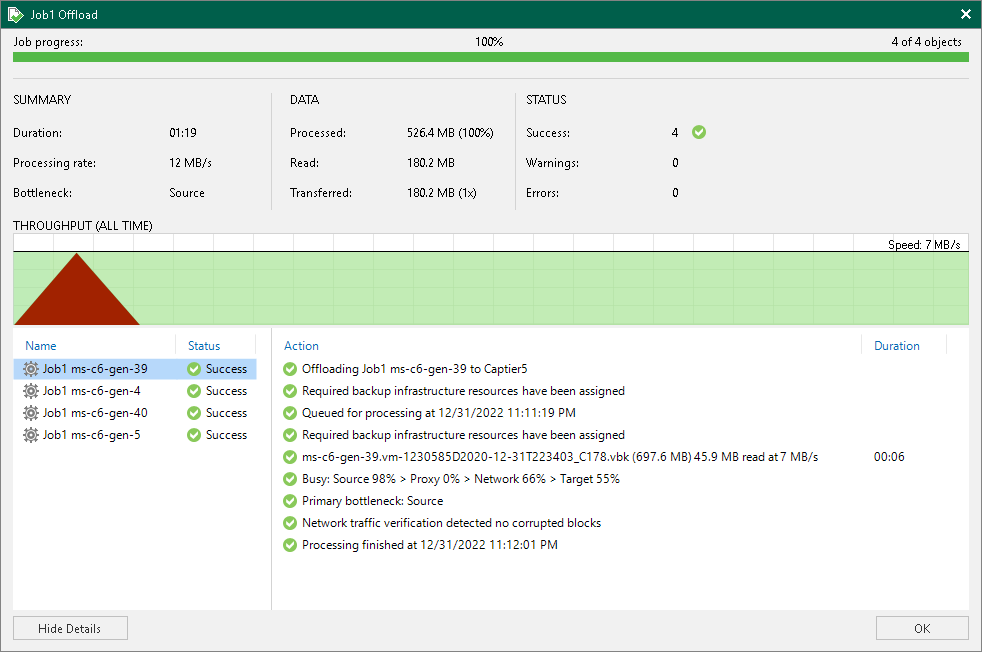
Veeam Backup & Replication displays the offload job session statistics for the following counters:
- The Job progress bar shows percentage of the offload session completion.
- The Summary box shows general information about the offload session:
- Duration — duration of the offload session.
- Processing rate — average speed of VM data processing. This counter is a ratio between the amount of data that has actually been read and the offload session duration.
- Bottleneck — bottleneck in the data transmission process. To learn more about bottlenecks, see Detecting Performance Bottlenecks.
- The Data box shows information about processed data:
- Processed — total size of all VM disks processed by the offload session.
- Read — the amount of data read from the extents.
- Transferred — the amount of data transferred from the extents to object storage.
- The Status box shows information about the job results. This box informs how many tasks have completed with the Success, Warning and Error statuses (1 task per 1 VM).
- The pane in the lower-left corner shows a list of objects processed by the offload session.
- The pane in the lower-right corner shows a list of operations performed during the session. To see a list of operations for a specific object, click the object in the pane on the left. To see a list of operations for the whole offload session, click anywhere on the blank area in the left pane.
Related Topics