 This is an archive version of the document. To get the most up-to-date information, see the current version.
Backup Repository Summary
Veeam ONE Monitor offers two types of summary dashboards for backup repositories:
Regular Backup Repository Summary
The regular repository summary dashboard provides overview details, capacity planning information and performance analysis for a chosen backup repository for the last week or month.
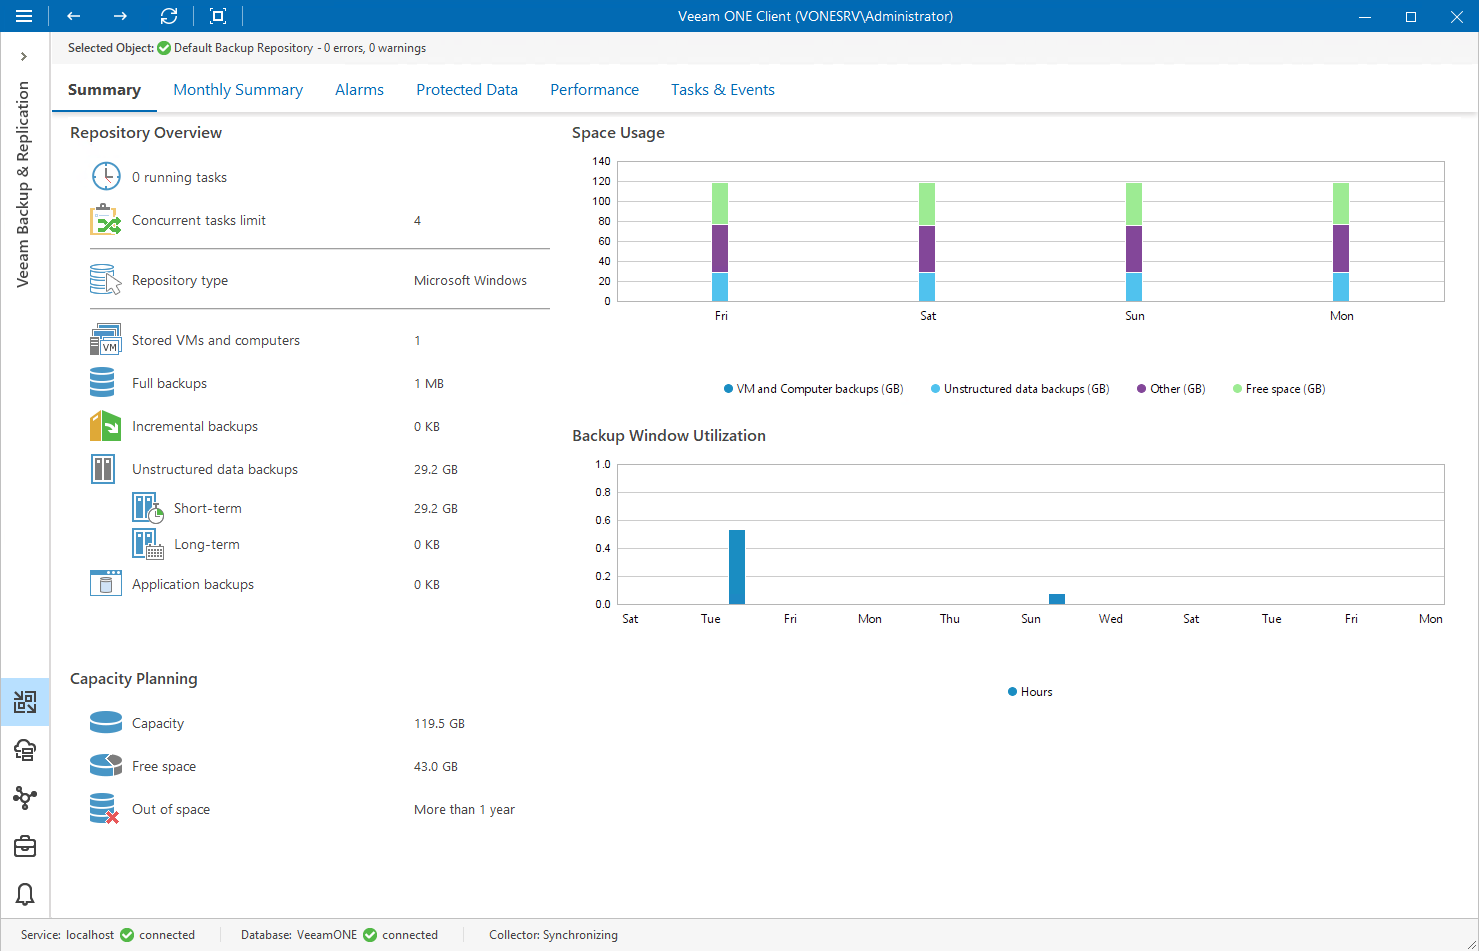
Repository Overview
The section outlines the following details:
- Number of tasks that are currently running on the repository
- Type of repository
- Number of VMs and computers whose data is stored in backups on repositories
- Cumulative amount of storage space occupied by full VM and computer backups
- Cumulative amount of storage space occupied by incremental VM and computer backups
- Number of concurrent VM disk processing tasks that can be assigned to the repository (as configured in backup repository settings)
Capacity Planning
The section outlines the following details:
- Storage capacity of the repository
- Amount of free space on the repository
- Number of days before the repository runs out of free space.
- To forecast the value, Veeam ONE uses a trend that is calculated based on historical statistics — it analyzes how fast the amount of free space on the repository was decreasing in the past and uses historical statistics to forecast how soon the repository will run out of space.
Free Space Usage
The chart shows the amount of used storage space against the amount of available space on the repository. If free space on the repository is running low, you might need to take some anticipatory action — for example, free up storage space on the repository, revise your backup retention policy or consider pointing jobs to a scale-out backup repository.
Backup Window Utilization
The chart shows the cumulative amount of time that the repository was busy with backup job tasks and backup copy job tasks during the past week or month. The chart can help you reveal possible resource bottlenecks on the repository side. If the backup window on the chart is abnormally large, this can evidence that the required I/O operations cannot complete fast enough, and your target is presenting a bottleneck for the whole backup data processing conveyor. To identify performance bottlenecks, you can switch to repository Veeam Backup & Replication Performance Charts.
Scale-Out Backup Repository Summary
The scale-out repository summary dashboard provides overview details, capacity planning information and performance analysis for a chosen scale-out backup repository for the last week or month.
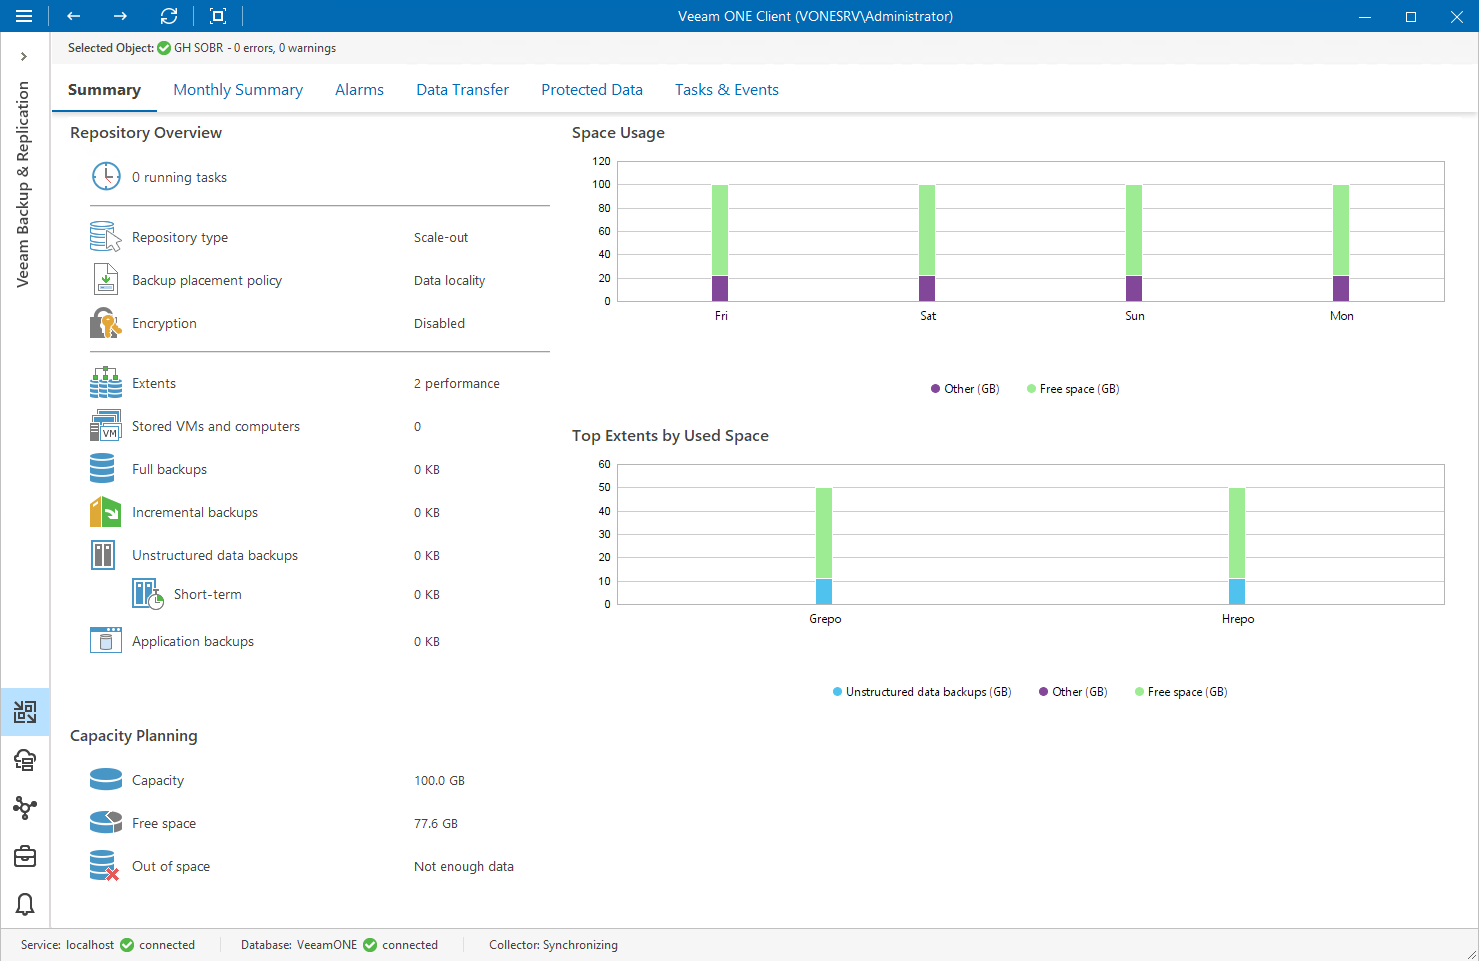
Repository Overview
The section provides the following details:
- Number of tasks that are currently running on the repository
- Repository type (Scale-out backup repository)
- Number of extents that make up the scale-out backup repository
- Number of VMs and computers whose data is stored in backups on repositories
- Cumulative amount of storage space occupied by full VM and computer backups
- Cumulative amount of storage space occupied by incremental VM and computer backups
- Backup policy (as configured in the scale-out repository settings)
Capacity Planning
The section includes the following details:
- Storage capacity of the repository
- Amount of free storage space on the repository
- Number of days before the repository runs out of free space.
- To forecast the value, Veeam ONE uses a trend that is calculated based on historical statistics — it analyzes how fast the amount of free space on the repository was decreasing in the past and uses historical statistics to forecast how soon the repository will run out of space.
Free Space Usage
The chart shows the amount of used storage space against the amount of available space on the repository. If free space on the repository is running low, you might need to take some anticipatory action — for example, free up storage space on the repository.
Top Extents by Used Space
The chart shows extents with the greatest amount of used storage space. For every extent in the chart, you can see the amount of used storage space against the amount of available space.