 This is an archive version of the document. To get the most up-to-date information, see the current version.
SMB Share Performance Chart
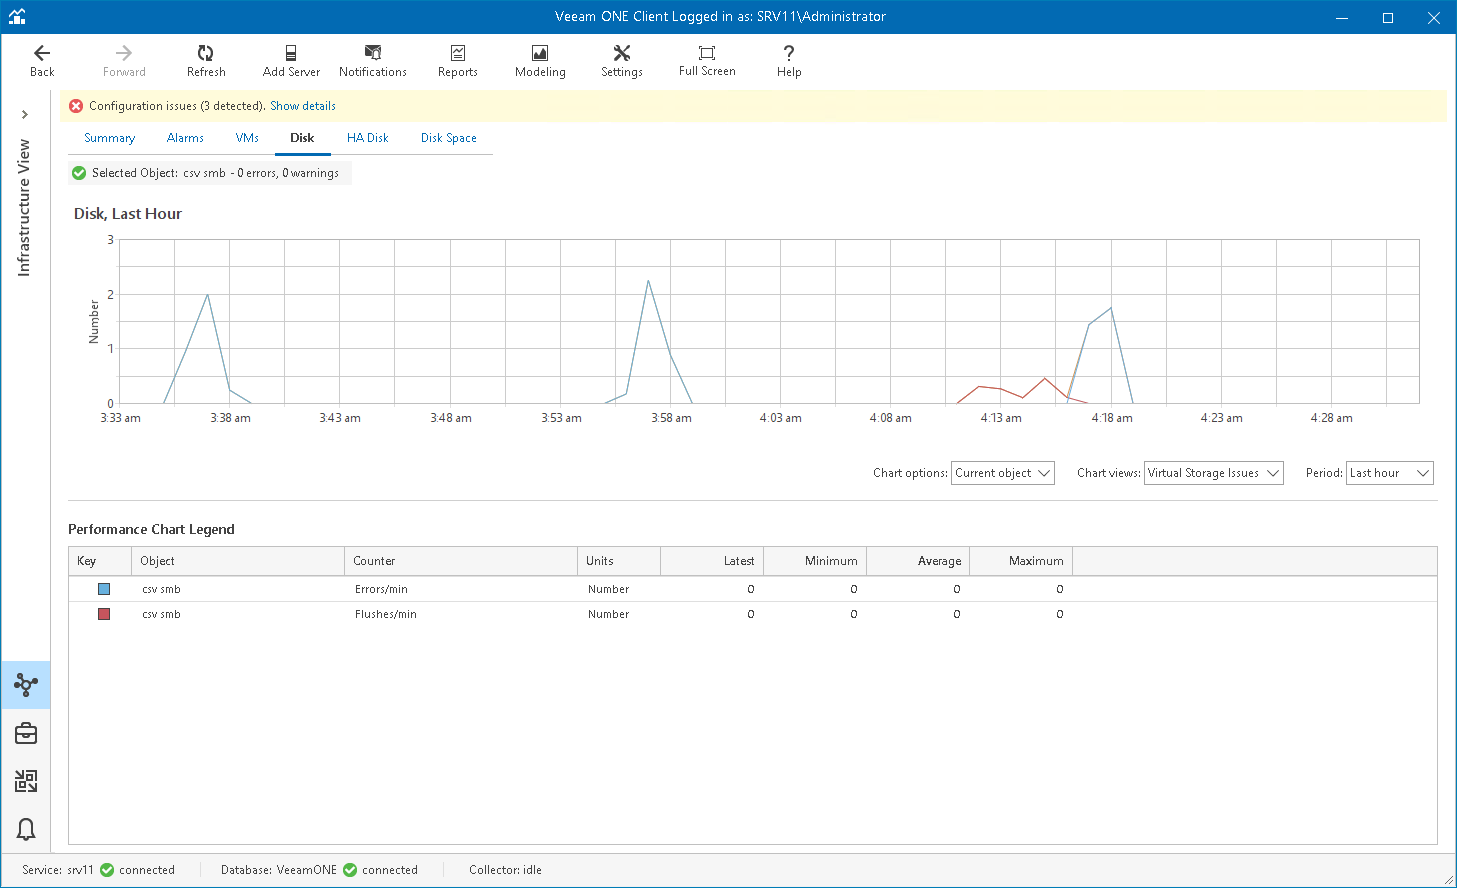
The Disk chart displays historical statistics on disk usage for the selected SMB file share.
The following table provides information on predefined views and counters.
Chart View | Counter | Measurement Unit | Description |
Virtual Storage Issues | Errors/min | Number | Number of virtual storage errors per minute. |
Flushes/min | Number | Number of virtual storage flush operations per minute. | |
Virtual Storage Usage | Virtual Storage Read Bytes/sec | B/s | Total number of bytes that have been read per second on the virtual device. |
Virtual Storage Write Bytes/sec | B/s | Total number of bytes that have been written per second on the virtual device. | |
Virtual Storage Usage Bytes/sec | B/s | Rate at which bytes have been read and written per second on the virtual device. | |
Virtual Storage IOPS | Reads/sec | Number | Total number of read operations that have occurred on the virtual device. |
Writes/sec | Number | The total number of write operations that have occurred on the virtual device. | |
IOPS | Number | Average number of read and write operations per second during collection interval. |