 This is an archive version of the document. To get the most up-to-date information, see the current version.
Virtual Machine Summary
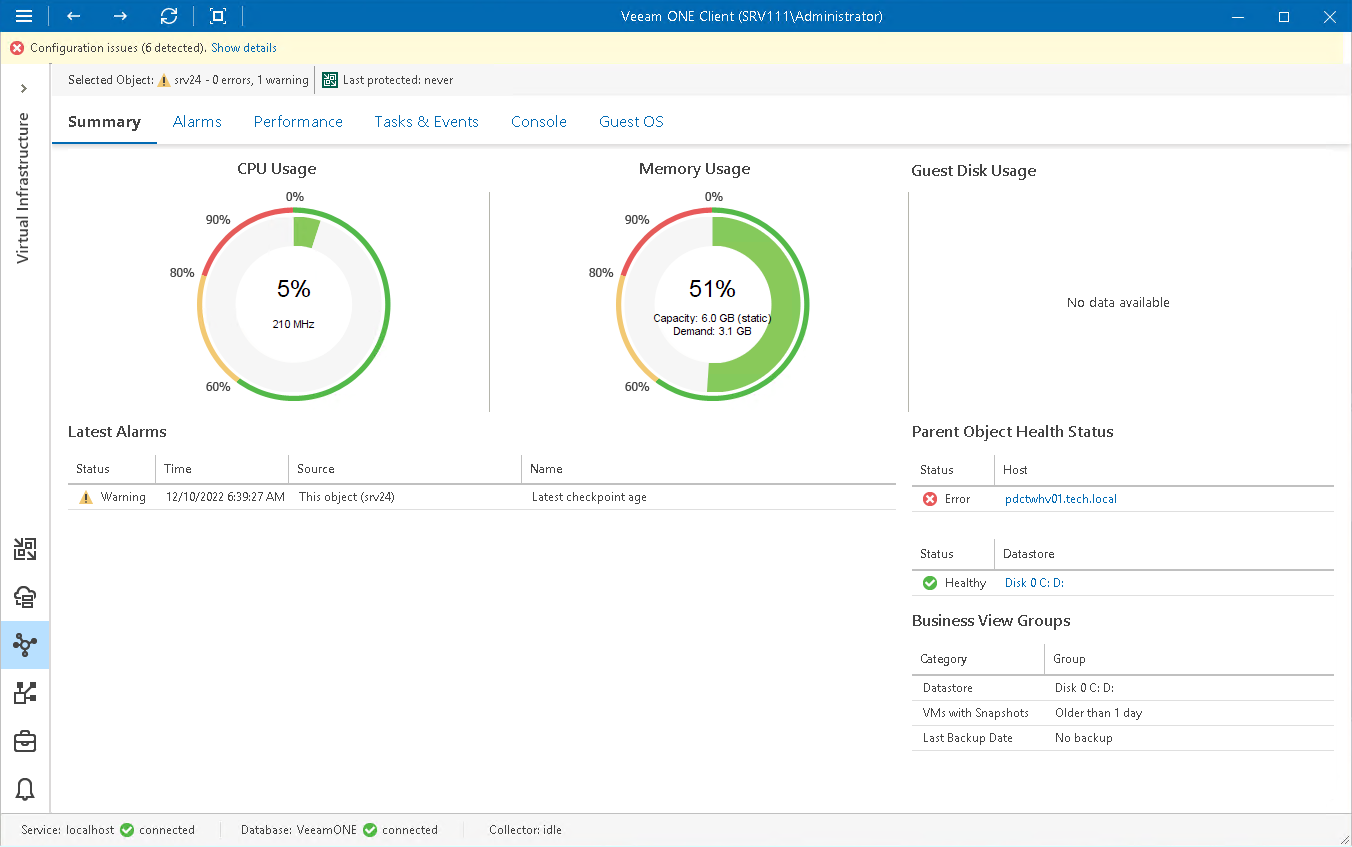
The virtual machine summary dashboard provides the health state and performance overview for the selected VM. In addition, this dashboard shows the state of objects that can affect the VM performance — the parent host and the volumes where VM files are located.
Selected Object
The section at the top of the dashboard shows the VM health state (number of warnings and errors) and the date when the latest backup or replica restore point was created for the VM with Veeam Backup & Replication.
CPU Usage, Memory Usage
The charts display the average amount of CPU and memory resources that the VM consumed during the latest data collection interval. Data collection interval depends on the data collection mode: 15 minutes for the Typical Deployment mode and 1 hour for the Advanced Scalability Deployment mode.
|
|
Guest Disk Usage
The chart displays the amount of available and used guest disk space with a breakdown by disks. By default, 5 guest disks with the greatest amount of used space are displayed. Use the Disks to show list to change the number of disks to display on the chart. Click the View all disks link to view details for all guest disks. In the Guests disks window, you can suppress Guest disk space alarms for specific disks. To suppress alarms for a disk, select the Suppress alarm check boxes next to the disk name.
Parent Object Health Status
The section displays the current state of the host where the VM resides and the state of volumes that host VMs files. Information in this section may help you to estimate the impact of parent objects on the VM performance. Click the host or volume name link to drill-down to the list of alarms for the host or volume.
Latest Alarms
The list displays the latest 15 alarms for the VM.
For details on working with alarms, see Veeam ONE Working with Alarms Guide.