 This is an archive version of the document. To get the most up-to-date information, see the current version.
Host Uptime
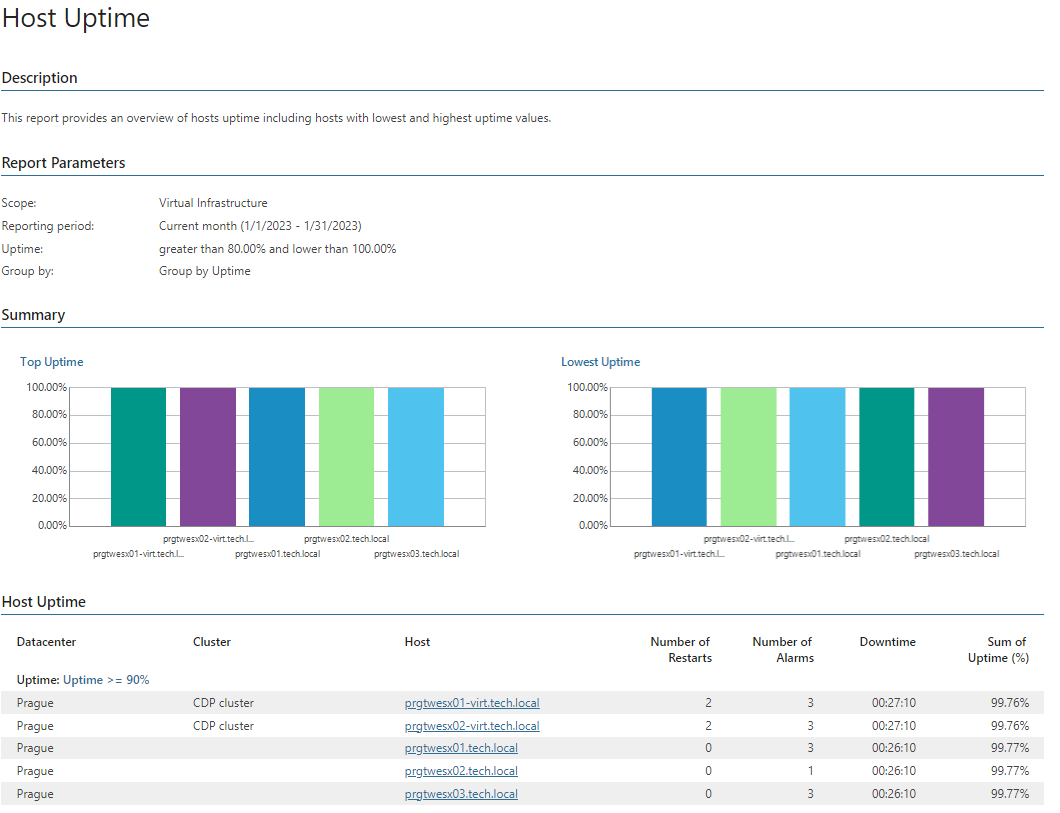
This report analyzes host uptime statistics to track host availability.
- Top Uptime and Lowest Uptime charts display top 5 hosts in terms of the highest and the lowest uptime values.
- Host Uptime table provides the list of hosts whose uptime values are lower and greater than the specified thresholds. Regardless of the report configuration, values in the Sum of Uptime (%) column will be highlighted with green (uptime 90%-100%), orange (uptime 80%-90%) or red (uptime 80%>).
Click a host in the Host column table to drill down to details on alarms triggered by Veeam ONE Monitor and host restarts.
Use Case
This report helps you discover the most and the least utilized hosts in the environment to restore their efficiency and improve target ROI.
Report Parameters
Scope: defines a virtual infrastructure level and its sub-components to analyze in the report.
Business View object(s): defines Business View groups to analyze in the report. The parameter options are limited to objects of the “Host” type.
Interval/Start Date - End Date: defines the time period to analyze in the report. Note that the reporting period must include at least one data collection session for the selected scope. Otherwise, the report will contain no data.
Uptime, greater than: defines the desired minimum uptime value.
Uptime, lower than: defines the desired maximum uptime value.
Group by: defines how data will be grouped in the report output (by Uptime, Datacenter or Cluster).