 This is an archive version of the document. To get the most up-to-date information, see the current version.
Over-provisioned Datastores
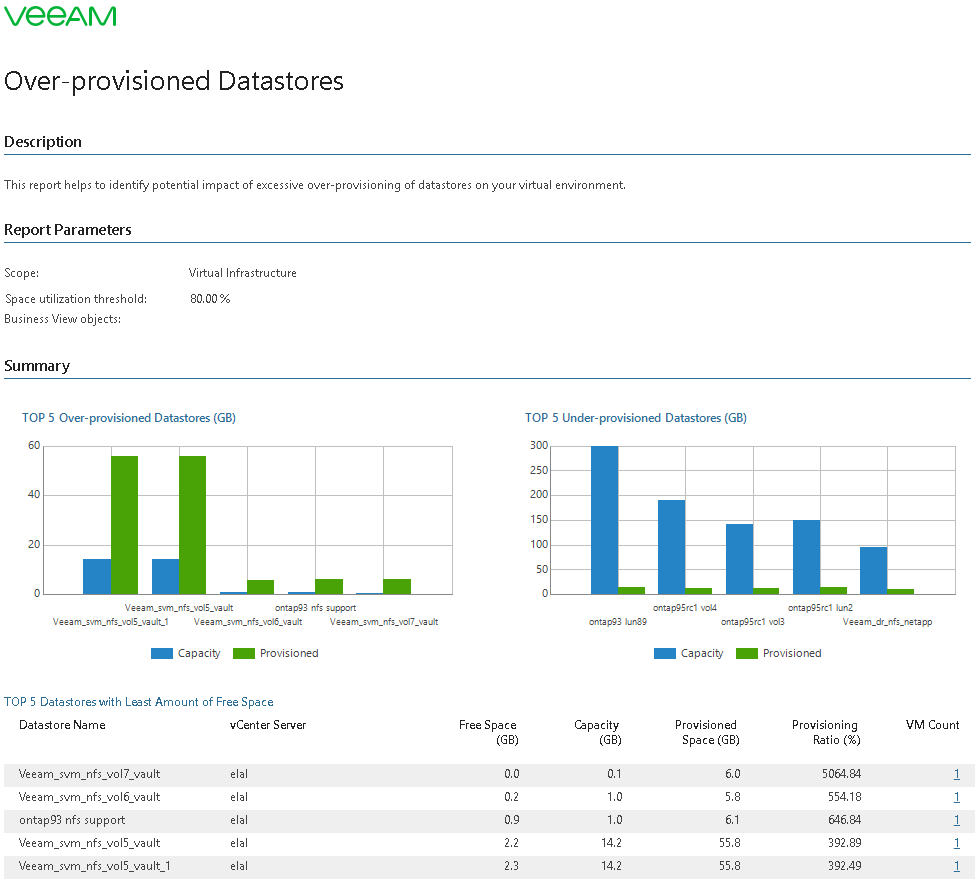
Thin provisioning allows administrators to dedicate more datastore space to VMs than there is real physical capacity. This report helps you assess the potential impact of excessive over-provisioning of datastores on performance of your virtual environment.
- TOP 5 Over-provisioned Datastores chart shows 5 datastores whose amount of provisioned storage space exceeds the total capacity.
- TOP 5 Under-provisioned Datastores chart shows 5 datastores whose amount of provisioned storage space is way below the total capacity.
- TOP 5 Datastores with Least Amount of Free Space table displays top 5 datastores that will run out of free space sooner than other datastores.
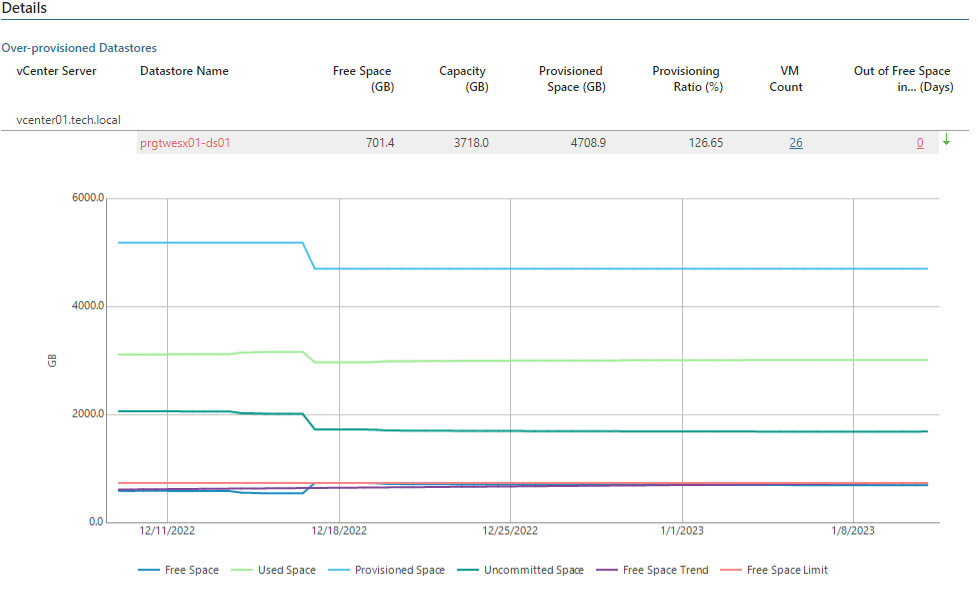
- Details section shows tables and charts that provide information on storage space utilization and the number of days left before the specified space utilization/free space threshold will be breached. Arrows in the Out of Free Space in … (Days) column show whether the amount of free space on the datastore has increased (green arrow), decreased (red arrow) or stayed the same (blue arrow) over the previous week.
|
|
Use Case
The report analyzes datastore space utilization trend and calculates the number of days left before storage utilization will breach the specified threshold.
Report Parameters
Scope: defines a virtual infrastructure level and its sub-components to analyze in the report.
Business View object(s): defines Veeam ONE Business View groups to analyze in the report. The parameter options are limited to objects of the Storage type.
Datastore space utilization (%): defines the threshold for the amount of space in use on datastores.
Datastore free space (GB): defines the threshold for the amount of free space left on datastores.
Show graphics: defines whether to include charts in the report output.