 This is an archive version of the document. To get the most up-to-date information, see the current version.
Oversized VMs
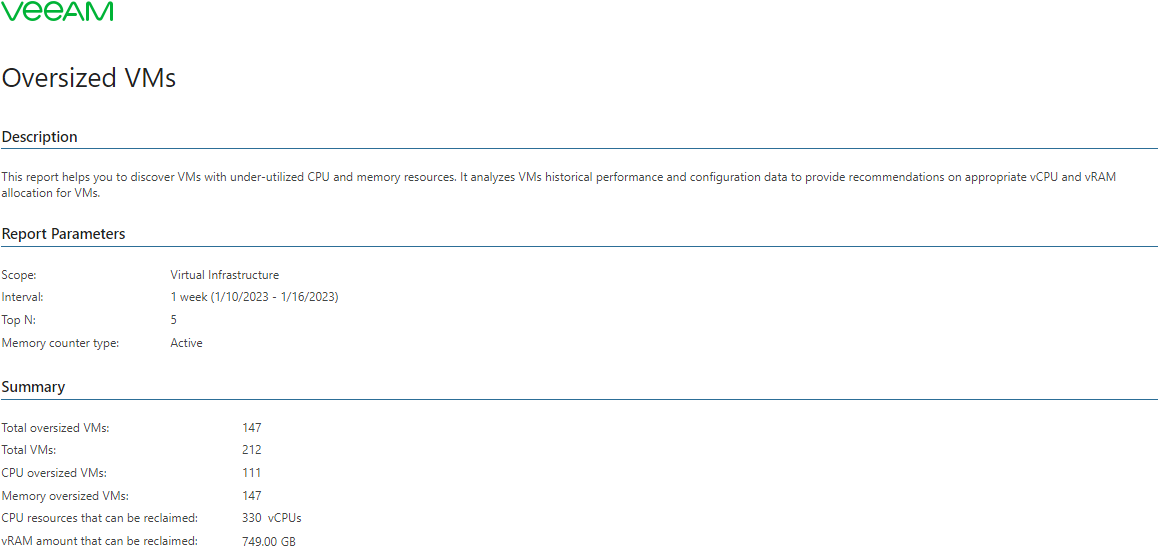
This report helps you to detect VMs that have more allocated vRAM or vCPU resources than they require. The report analyzes historical performance and configured resource allocation to provide recommendations for an optimized VM configuration and allocation of resources.
- Summary Information section provides details on the total number of VMs, number of oversized VMs by vCPU and vRAM, and amount of vCPU and vRAM resources that can be reclaimed.
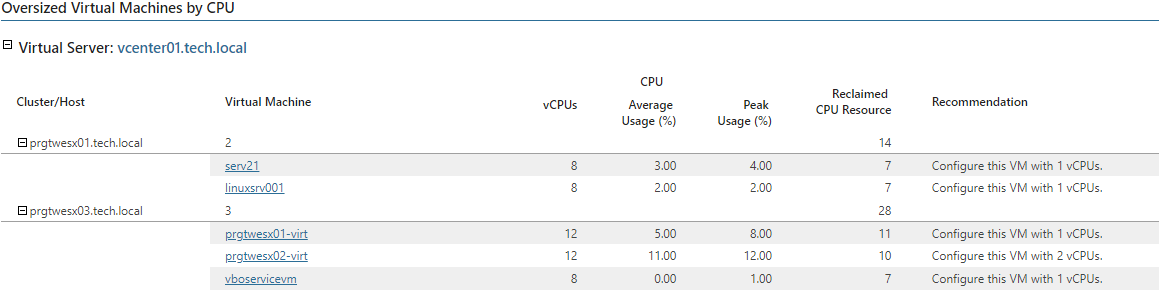
- Oversized Virtual Machines by CPU table provides a list of VMs from which you can reclaim vCPU resources. For each VM, the table details the number of configured vCPUs, average and peak CPU usage, and provides recommendations on vCPU configuration.
Click a VM name in the details table to drill down to VM performance charts that show how CPU usage was changing during the reporting period.
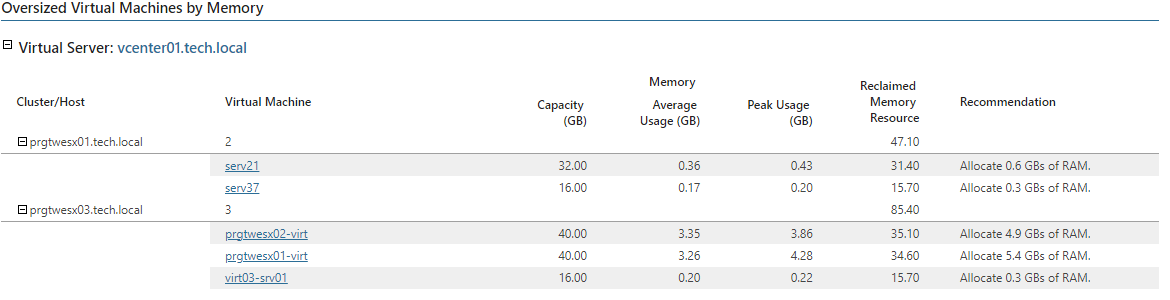
- Oversized Virtual Machines by Memory table provides a list of VMs from which you can reclaim vRAM resources. For each VM, the table details the amount of allocated memory, average and peak memory usage, and provides recommendations on memory configuration.
Click a VM name in the details table to drill down to VM performance charts that show how memory usage was changing during the reporting period.
Use Case
This report helps you discover VMs with excessive hardware provisioning. You may consider decreasing hardware provisioning for the VM in vSphere configuration options, relocating the VM to less powerful hosts, or adding more VMs to a shared resource pool to optimize resource allocation and reclaim wasted resources.
Report Parameters
Scope: defines a virtual infrastructure level and its sub-components to analyze in the report.
vCD object(s): defines vCloud Director components to analyze in the report.
Business View object(s): defines Veeam ONE Business View groups to analyze in the report. The parameter options are limited to objects of the Virtual Machine type.
Interval - Interval Type: defines the time period to analyze in the report. Note that the reporting period must include at least one data collection session for the selected scope. Otherwise, the report will contain no data.
Memory counter: defines whether the Memory Active or Memory Consumed performance metric should be analyzed in the report.
Top N: defines the maximum number of VMs to display in the report output.
Business hours from - to: defines time of a day for which historical performance data will be used to calculate the performance trend. All data beyond this interval will be excluded from the baseline used for data analysis.