 This is an archive version of the document. To get the most up-to-date information, see the current version.
Veeam Backup & Replication Dashboard
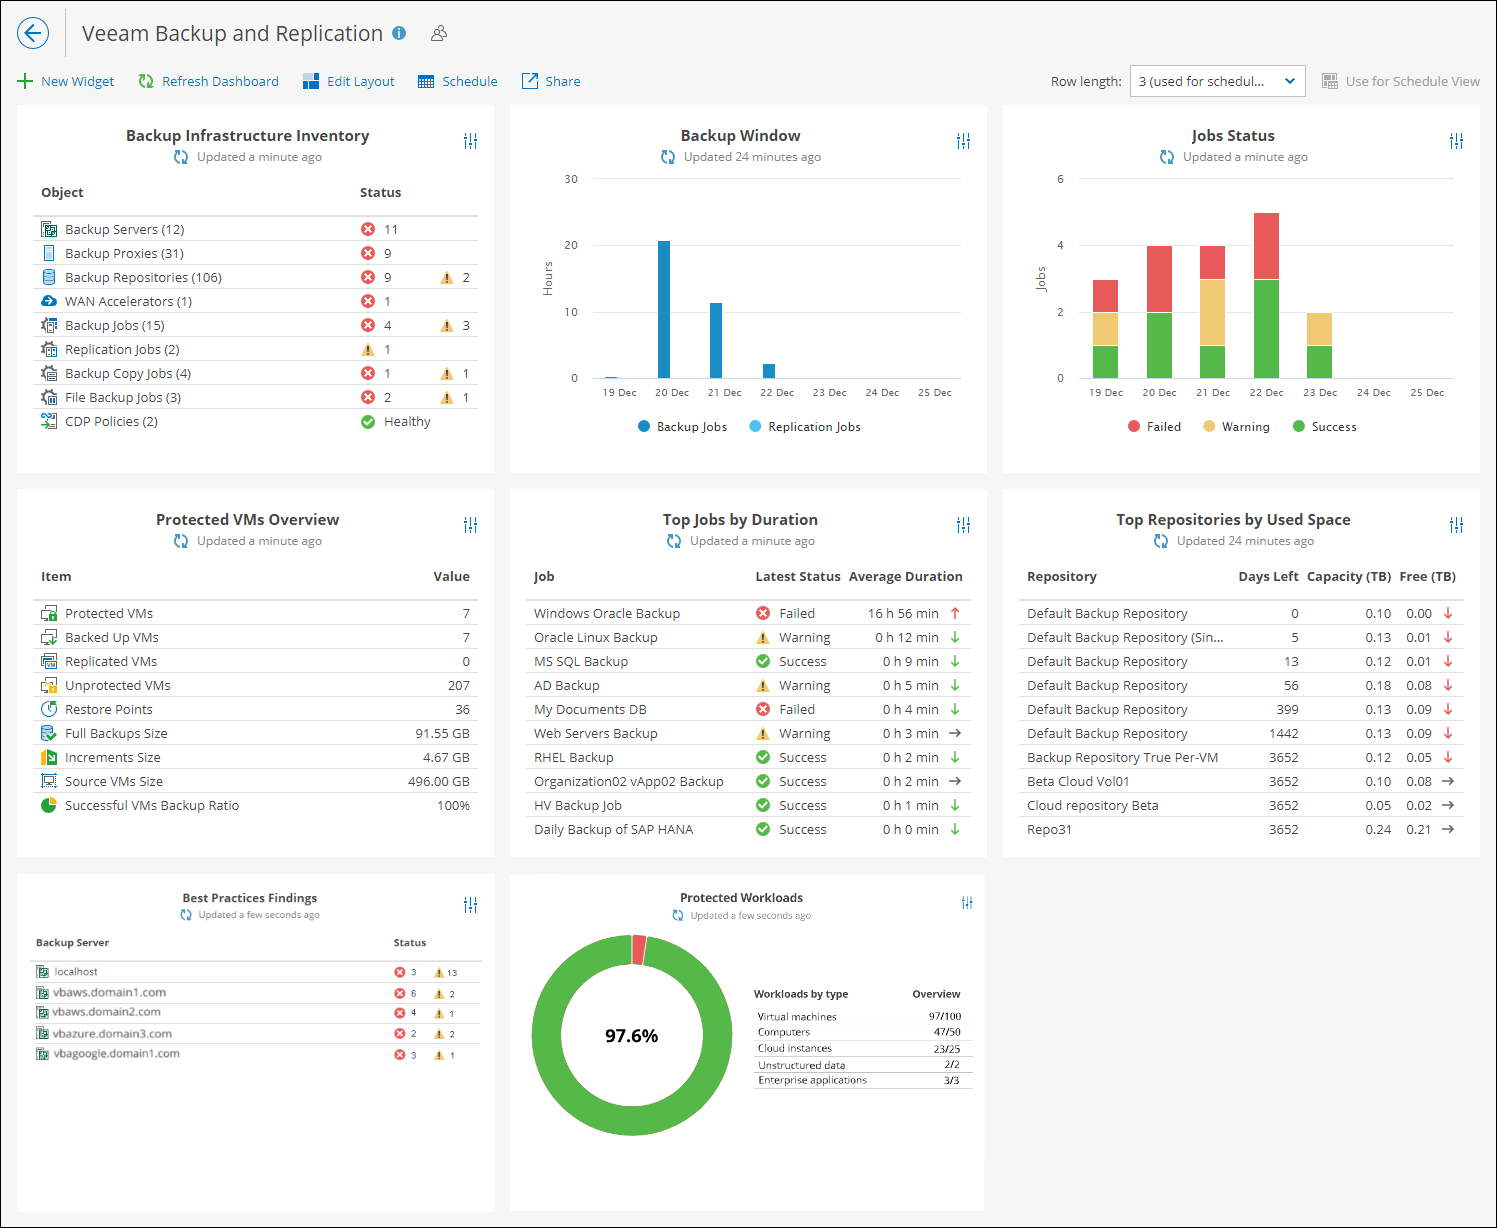
The Veeam Backup & Replication dashboard provides information on the state of the key backup infrastructure components. The built-in widgets display a list of important events and help focus on the core efficiency indicators.
Widgets Included
- Backup Infrastructure Inventory
This widget describes your backup infrastructure inventory and shows how many backup components of each type are deployed. The widget reflects the health state of backup infrastructure and displays healthy objects (green), objects with warnings (yellow), objects with errors (red).
The widget also provides details on scheduled backup, backup copy and replication jobs, and the state of the latest job sessions.
- Backup Window
This widget shows the total duration of daily backup and replication job sessions. It allows you to track the efficiency of backup jobs, to detect issues occurred in the backup process and to check whether jobs completed within the prescribed backup window.
- Jobs Status
This widget provides information on the completion state of scheduled backup and replication jobs. It displays a daily summary of successfully completed jobs, and shows the number of jobs that completed with warnings and errors during the past week.
The widget helps you assess the efficiency of your data protection operations.
- Protected VMs Overview
This widget displays information on VMs protected with backup and replication jobs, specifically:
- Protected VMs — the total number of VMs protected with backups or replicas
- Backed Up VMs — the total number of VMs for which backups are available
- Replicated VMs — the total number of VMs for which replicas are available
- Restore points — the total number of available restore points for protected VMs
- Full backups — the amount of storage space consumed by full backups
- Increments — the amount of storage space consumed by incremental backups
- Source VMs Size — the total size of storage space consumed by source VMs on production storage
- Successful VMs Backup ratio — the percentage of backup and replication sessions that completed successfully during the past week against the total number of sessions.
- Top Jobs by Duration
This widget displays top 10 jobs in terms of the longest duration, job completion status and the value of the average weekly duration. The widget helps you assess the backup infrastructure health and efficiency.
Arrows on the right show how job duration has changed over the previous week*.
- Top Repositories by Used Space
This widget displays 10 repositories that will run out of free space sooner than other repositories, as well as total capacity and free space left on these repositories. The widget also forecasts how many days remain before the repositories will run out of free space.
Arrows on the right show how the repository free space value has changed over the previous week*.
*The arrows allow you to compare the results of this week to the results of the previous week and to track how the trend has evolved. For example, a blue arrow pointing right next to the Duration value means that duration of the job has not changed over the past week, a green arrow pointing down means that job duration has decreased, while a red arrow pointing up means that job duration has increased.