This document is not maintained any longer.
Monitoring Clients
You can monitor the state of clients connected to the VPN, get information about the amount of sent and received traffic and so on. Veeam PN provides the following monitoring views:
- Veeam PN Overview lets you get an at-a-glance view of the VPN infrastructure and clients.
- The Performance view lets you get granular information on specific clients and view specific network metrics.
Monitoring views are available in the network hub and site gateway portals. The network hub portal provides monitoring data for all Veeam PN clients. The site gateway portal lets you monitor the state of the on-premises network where the site gateway resides.
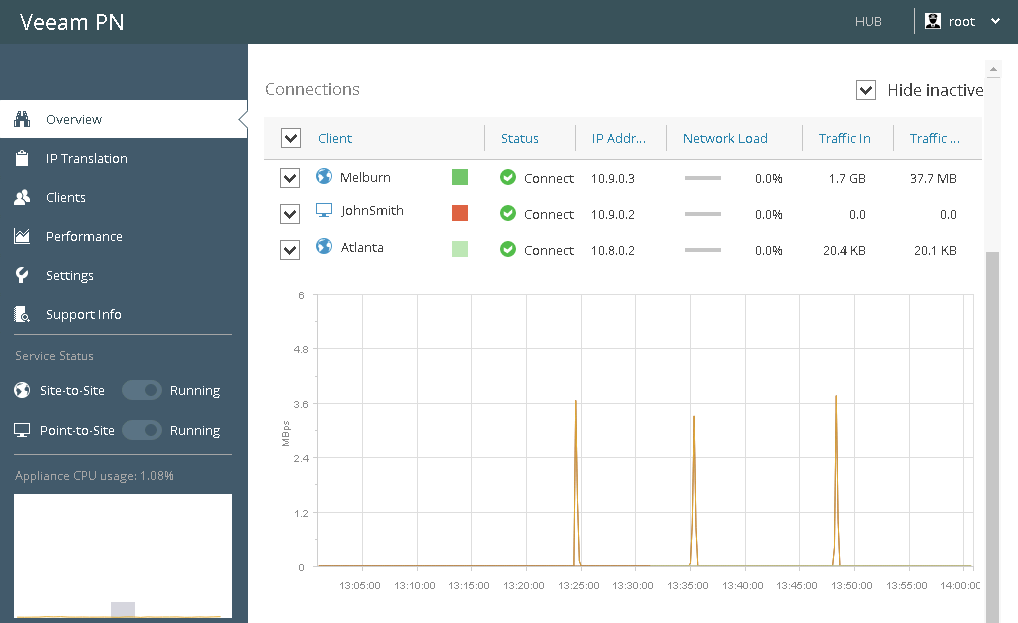
Veeam PN Overview
Veeam PN Overview is displayed when you access the Veeam PN portal. You can use this view to monitor the state of clients, network load, incoming and outgoing traffic and get information about events that have occurred in the VPN.
By default, Veeam PN displays information for all Veeam PN clients. If necessary, you can display information about specific clients or clients that are currently connected to the network hub:
- To display information about specific clients, select check boxes next to them in the clients list.
- To display information about currently connected clients, select the Hide inactive check box on the right of the clients list.
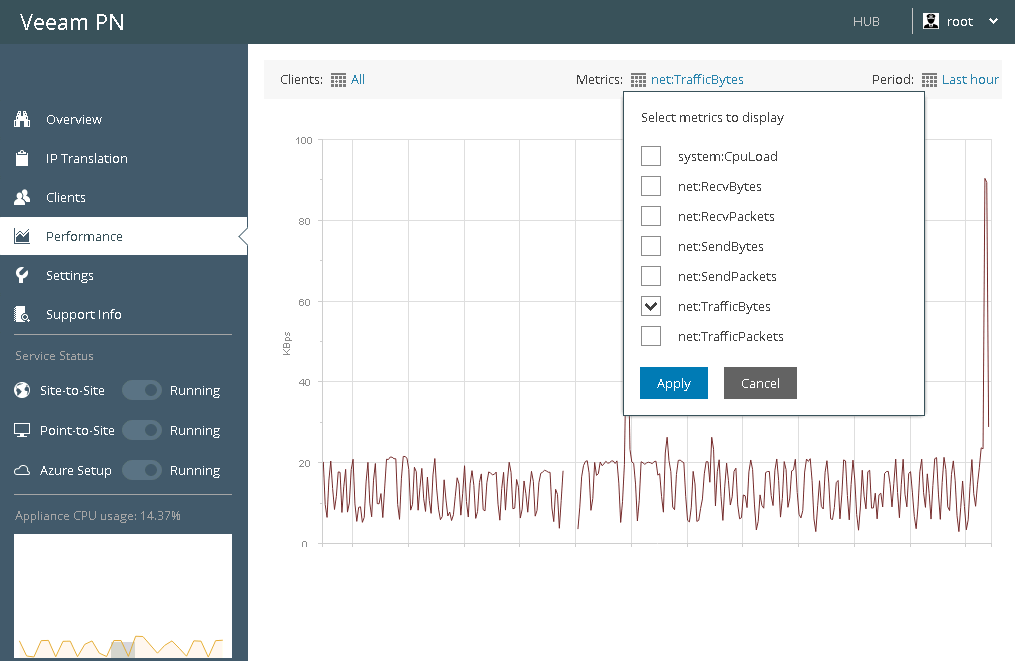
Performance View
You can use the Performance view to get information about specific network metrics granularly for one or more Veeam PN clients.
To display the Performance view:
- Log in to the Veeam PN portal.
- In the configuration menu on the left, click Performance.
- At the top of the chart, click the link next to the Clients field and select check boxes next to clients whose data you want to display in the chart.
- At the top of the chart, click the link next to the Metrics field and select one or more network metrics that you want to display in the chart. Veeam PN tracks the following metrics:
- Received bytes — amount of data (in bytes) received from the client through the VPN tunnel.
- Received packets — number of packets received from the client through the VPN tunnel.
- Sent bytes — amount of data (in bytes) sent to the client through the VPN tunnel.
- Sent packets — number of packets sent to the client through the VPN tunnel.
- Traffic bytes — total amount of traffic (in bytes) sent and received by the client through the VPN tunnel.
- Traffic packets — total number of packets sent and received by the client through the VPN tunnel.
Note |
If you have chosen to chart network data for several clients, you will be able to select one network metric only. |
- At the top of the chart, click the link next to the Period field and select a period for which you want to chart network data: Last hour, Last 6 hours, Last 24 hours, Last week or Last month.