
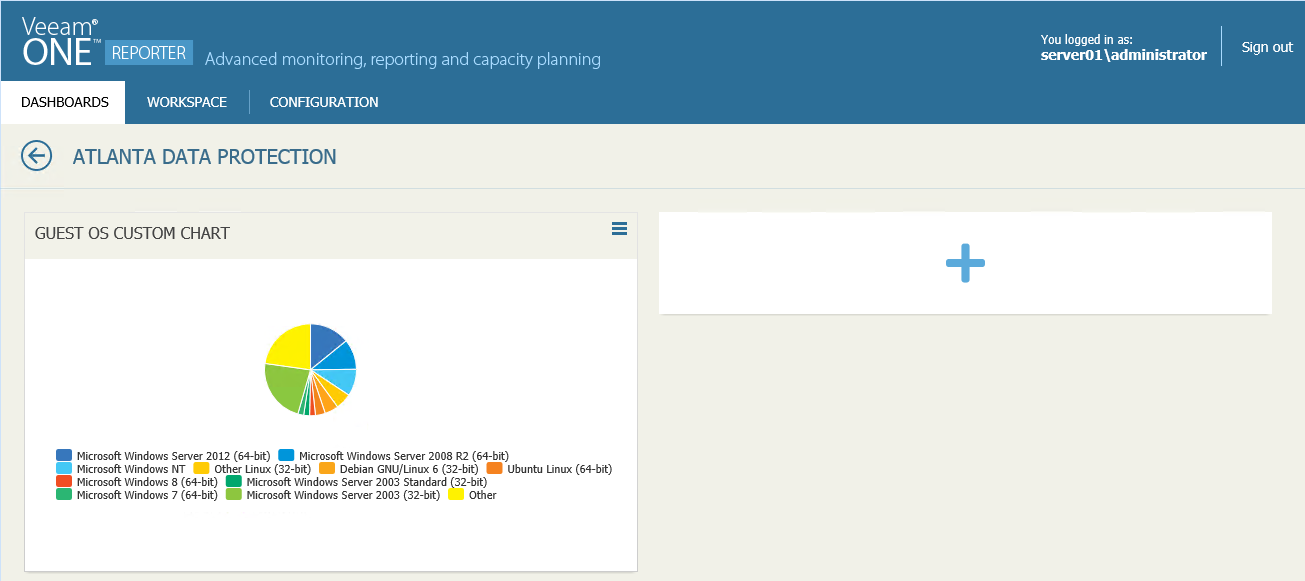
You can add widgets that are based on the Custom Infrastructure report. For this type of widgets, you can choose to present virtual infrastructure data as an exploded pie, clustered column or stacked column.
Before you add a widget to a dashboard, you must save the Custom Infrastructure report with the necessary parameters:
- Open the Workspace section.
- Open the Custom Infrastructure report and specify the necessary report parameters: data collection session, report scope, type of virtual infrastructure objects and object properties (columns) to be displayed in a widget. If required, define additional filtering and sorting settings.
- Save the report.
For details, see Saving Reports.
Next, add to a dashboard a widget associated with the saved report:
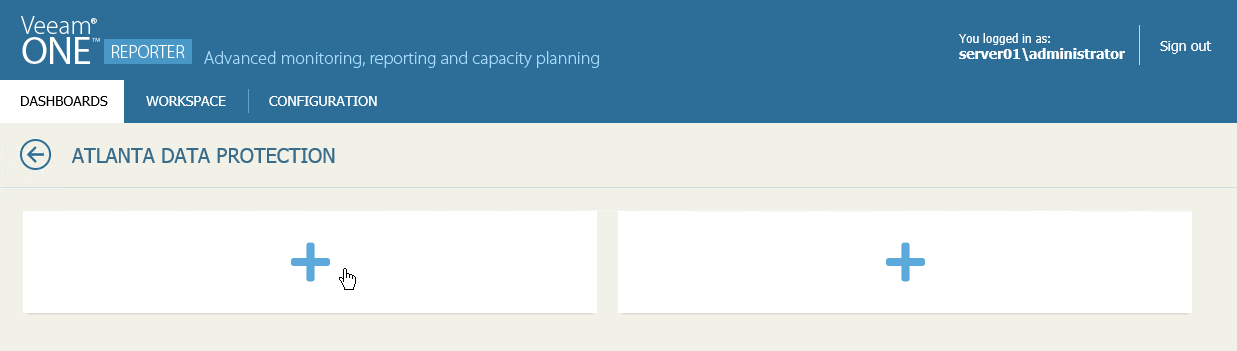
- Open the Dashboards section.
- Open the menu at the top right corner of the necessary dashboard and click Edit dashboard.
- Click the plus icon in one of the dashboard cells to launch the Add widget wizard.
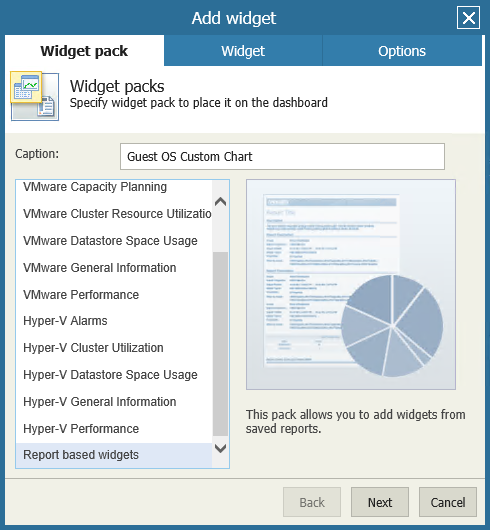
- At the Widget pack step of the wizard, specify the widget name and choose the widget pack.
- In the Caption field, specify the widget name.
The widget name will be displayed at the top of the widget on the dashboard. You can leave the field empty if you do not want to display the widget caption.
- Double-click Report based widgets or select the Report based widgets option and click Next.
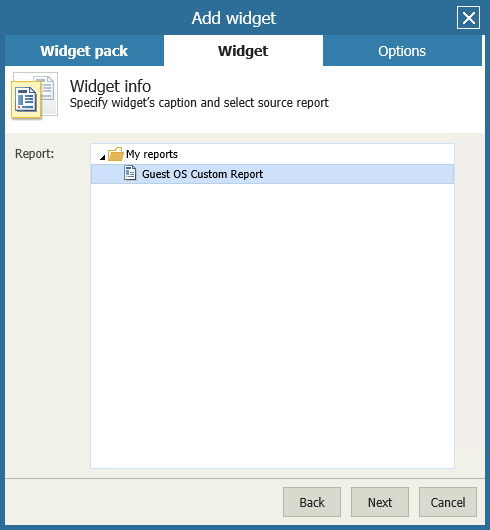
- At the Widget step of the wizard, choose the saved Custom Infrastructure report. Double-click the report or select the report and click Next.
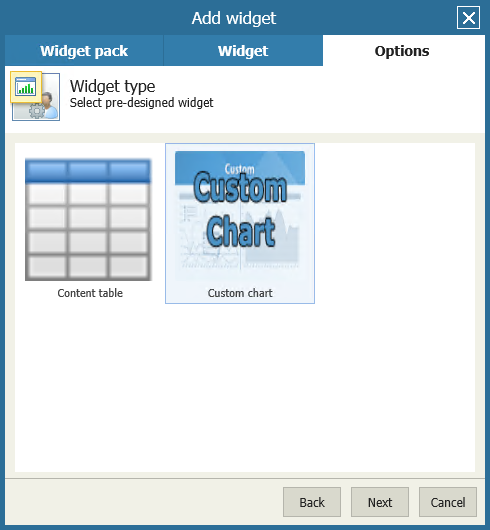
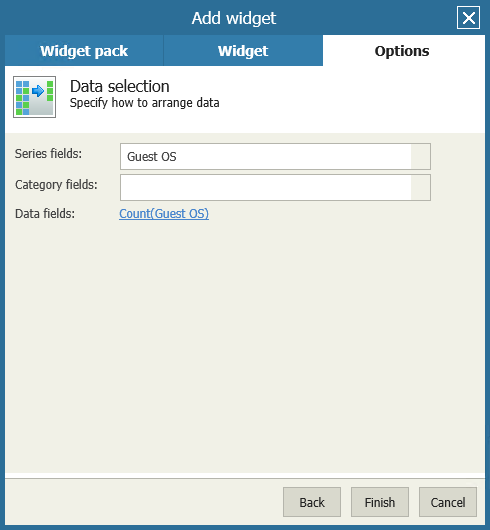
- At the Options step of the wizard, select how you want to present report data in the widget.
- To present data in a table, select Content table and click Finish. Veeam ONE Reporter will add a widget with a table to the dashboard.
- To present data in a chart, select Custom chart and click Next.
- Select the type of a chart to display in the widget and click Next.

- Select series fields, category fields and data fields to define what type of data will be presented in the chart and how this data will be grouped. You can only choose properties that you have previously added as columns in the Custom Infrastructure report.
- Series fields — select what type of data will be plotted in the chart. The series field is a set of related data that is distinguished by a unique color and presented in the chart legend.
- Category fields — select a criterion that will be used to group series fields. A category field is usually presented as a group of series fields on the horizontal axis.
- Data fields — select what type of values will be be aggregated into a single slice, bar or a column in the chart and select the aggregate function.
Every chart type requires a specific set of data — for example, exploded pies are two-dimension charts so you need to select only the series fields and data fields, while for clustered column charts, you need to select series fields, category fields and data fields. Basic principles of working with custom charts and simple examples are described in Appendix B. Custom Charts for Report-Based Widgets.
- Click Finish to add the widget to the dashboard.
- Repeat steps 3-8 for each new widget you want to add to the dashboard.
