
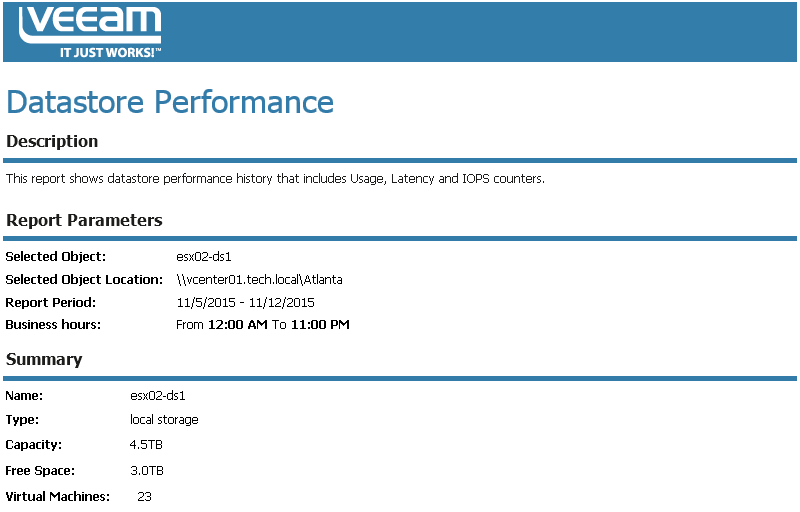
This report aggregates historical data and shows performance statistics for a selected datastore across a time range.
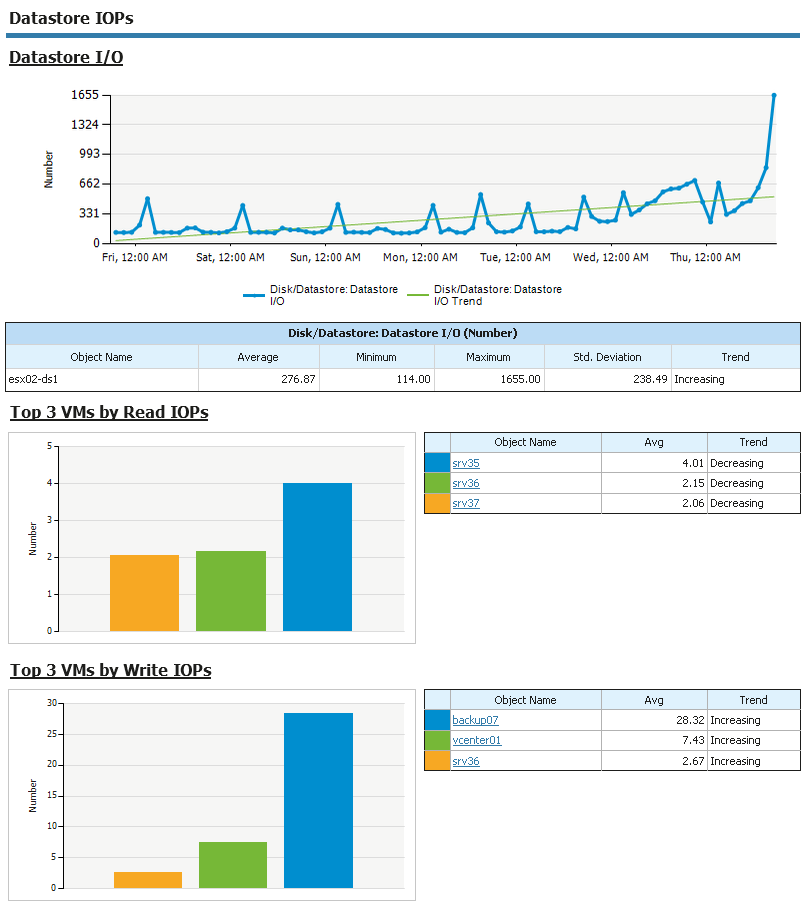
The report shows tables and performance charts with statistics on read/write rates, read/write latency, IOPS and errors for the datastore. The report also lists top 3 resource consuming VMs and calculates resource usage trends for them.
|
Click a VM name in the list of top 3 resource consuming VMs to drill down to performance charts with statistics on CPU, memory, disk and network usage for the VM. |
Use Case
The report helps you assess current load on your datastores and identify performance issues, such as excessive bus resets or high command aborts rates.
Report Parameters
Object: defines the datastore to analyze in the report.
Interval/Start Date - End Date: defines the time period to analyze in the report. Note that the reporting period must include at least one data collection session for the selected datastore. Otherwise, the report will contain no data.
Business hours from - to: defines time of a day for which historical performance data will be used to calculate the performance trend. All data beyond this interval will be excluded from the baseline used for data analysis.
