
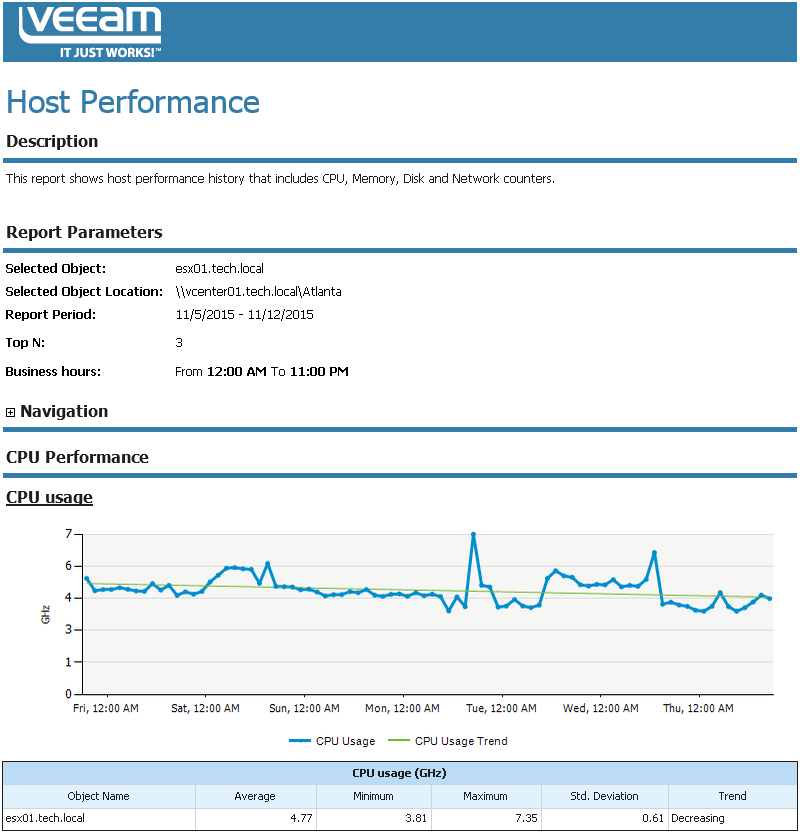
This report aggregates historical data and shows performance statistics for a selected host across a time range.
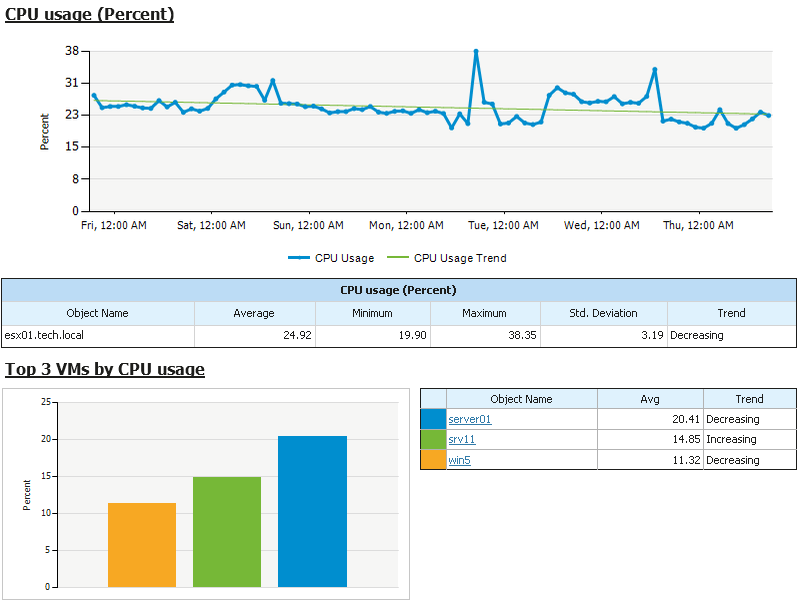
The report shows tables and performance charts with statistics on CPU, memory, disk and network usage for the host. The report also lists top resource consuming VMs and calculates resource usage trends for them.
|
|
Use Case
The report provides an overview of hardware resource consumption for the selected host. This information may help you identify hosts with performance issues, balance workloads, right-size resource provisioning and assure high availability/failover protection for VMs across the growing virtual environment.
Report Parameters
Object: defines the host to analyze in the report.
Interval/Start Date - End Date: defines the time period to analyze in the report. Note that the reporting period must include at least one data collection session for the selected host. Otherwise, the report will contain no data.
Top N: defines the maximum number of VMs to display in the report output.
Business hours from - to: defines time of a day for which historical performance data will be used to calculate the performance trend. All data beyond this interval will be excluded from the baseline used for data analysis.
