
This report collects historical information and shows performance statistics on vApps over a specific time period. The report features a list of predefined performance counters and allows you to analyze memory, CPU, memory, disk and network usage.
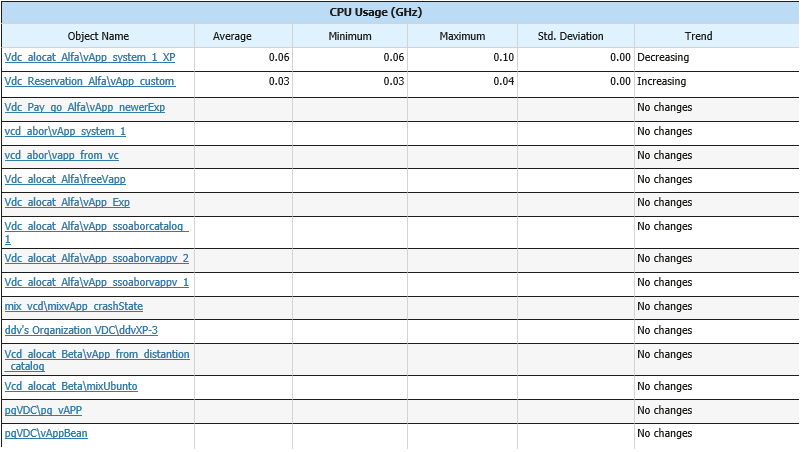
The report shows performance charts with resource usage statistics, rates the VMs by the resource usage level, and analyzes the resource usage trend.
Use Case
The report provides an overview resource consumption of multiple vApps. This information may help you identify VMs with performance issues, balance workloads, right-size resource provisioning and optimize overall performance.
Parameters
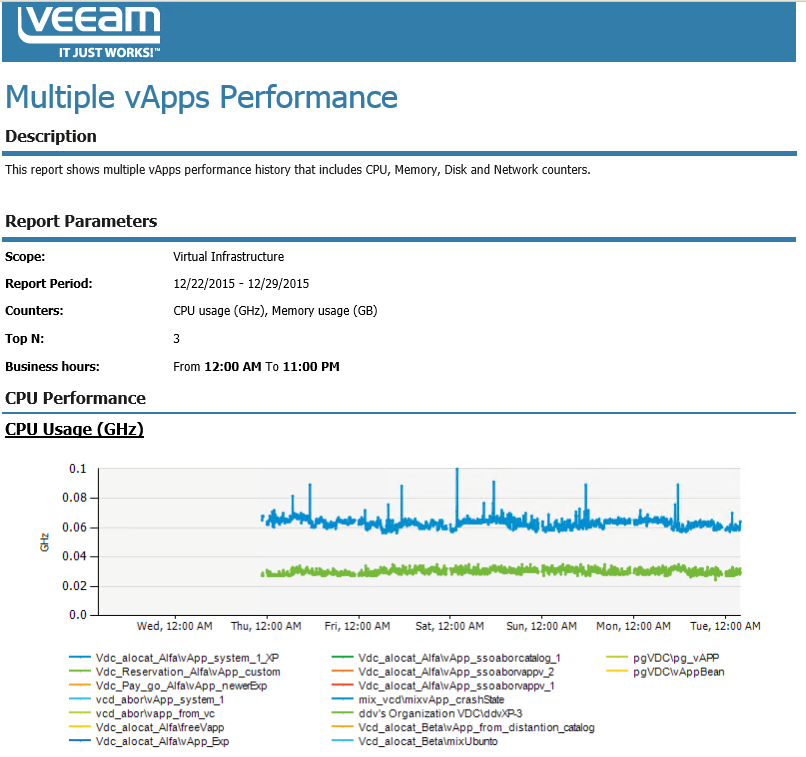
Scope: defines the organization whose vApps should be analyzed in the report.
Interval/Start Date - End Date: defines the time period to analyze in the report.
Top N: defines the maximum number of VMs to display in the report output.
Counters: defines a list of performance counters to analyze in the report.
Show graphics: defines whether to include charts in the report output.
Business hours from - to: defines time of a day for which historical performance data will be used to calculate the performance trend. All data beyond this interval will be excluded from the baseline used for data analysis.
