Top Noisy vSphere Objects
This report analyzes alerting activity and provides information on virtual infrastructure objects that caused the greatest number of alerts across a time range.
Example Output
In this example, the report allows you to detect top 10 datastores in your virtual infrastructure that caused the greatest number of alerts during this week
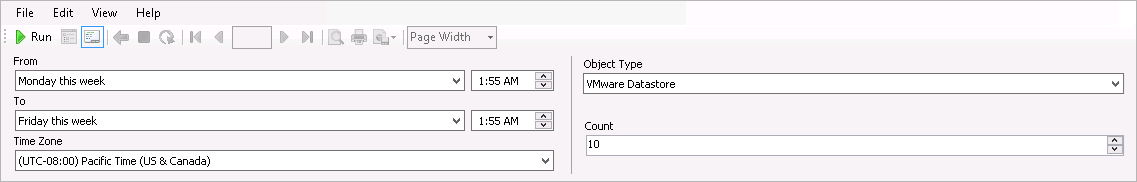
To run this report:
- From the From list, select This week > Monday. From the To list, select This week > Friday.
- From the Object Type list, select VMware Datastore.
- In the Count field, enter 10.
- Click Run to view the report.
The report will show statistics for top 10 "noisy" VMware datastores.
It can be seen from the report output below that the “Top Noisy” infrastructure object of the week was the PROD-200GB datastore since it caused:
- 475 alerts in total (that is, 12% of all alerts included in the report)
- 275 Veeam VMware: Datastore Latency Analysis alerts triggered by the Veeam Virtualization Extensions VMware Monitoring management pack
- 200 Veeam VMware: Datastore Free Space Analysis alerts triggered by the Veeam Virtualization Extensions VMware Monitoring management pack
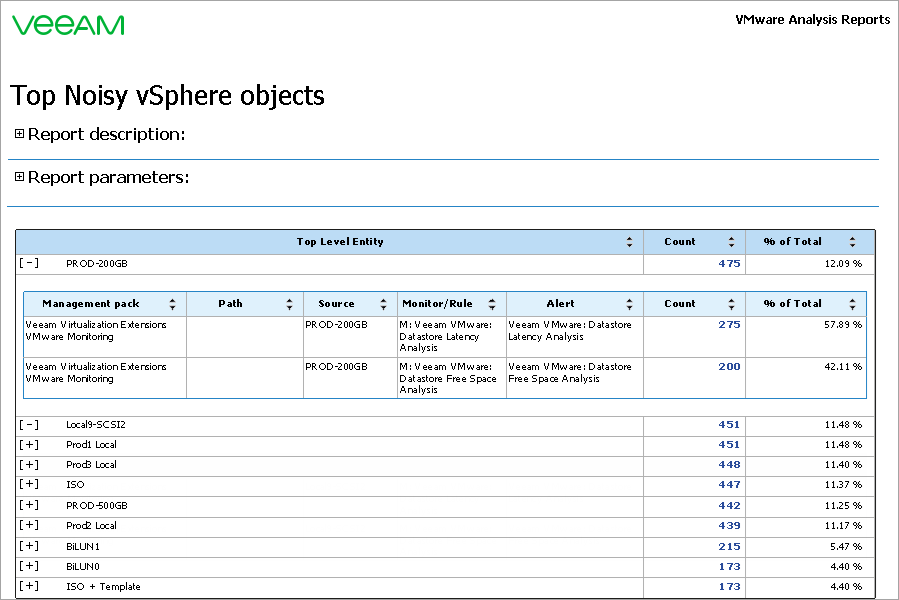
You can click a number in the Count column of the output table to drill down to the Veeam Alert History Report from the Veeam Report Library.