This is an archive version of the document. To get the most up-to-date information, see the current version.
Step 4. Define Chart Display Options
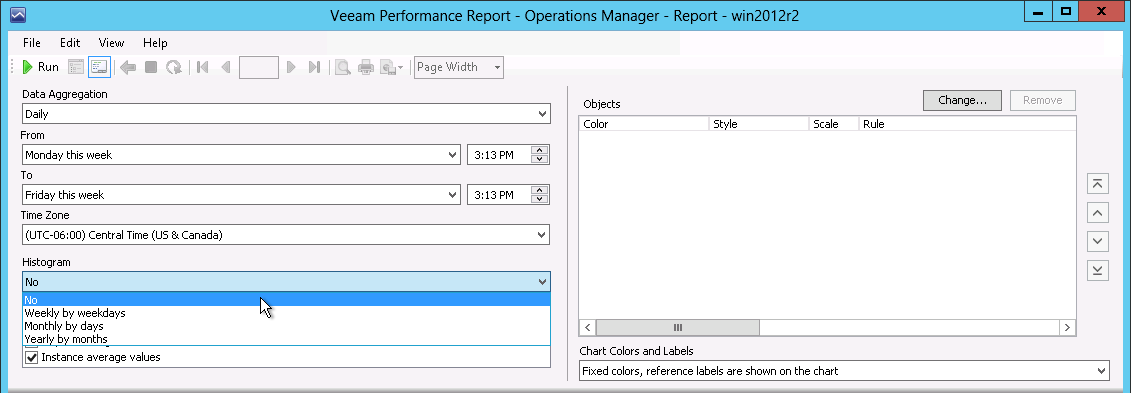
From the Histogram list, choose what type of values will be displayed on the x-axis of the report chart.