This is an archive version of the document. To get the most up-to-date information, see the current version.
Report Output
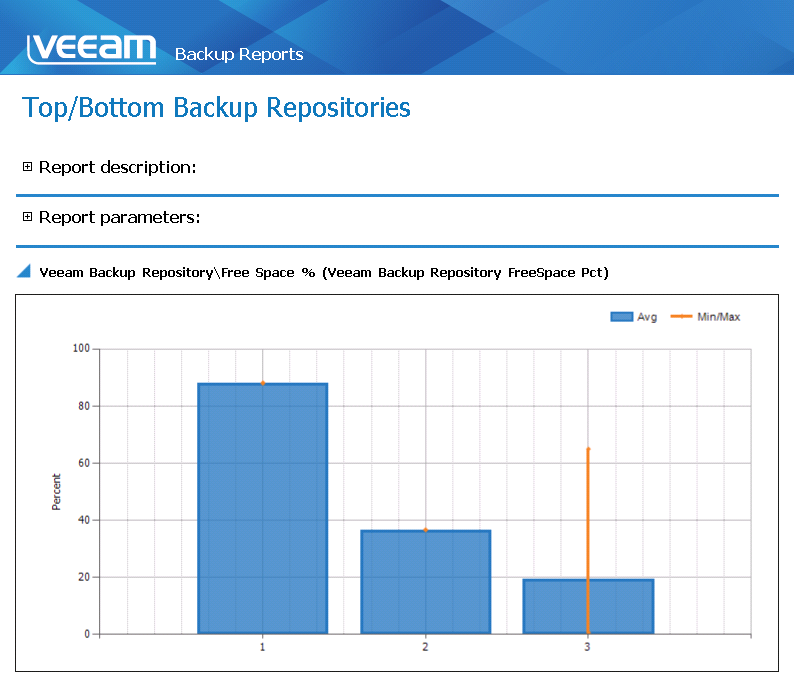
The report will show 3 repositories with the largest amount of free space. The chart will display the following details for every repsository: average free space usage and the minimum-to-maximum free space usage range for the selected period.
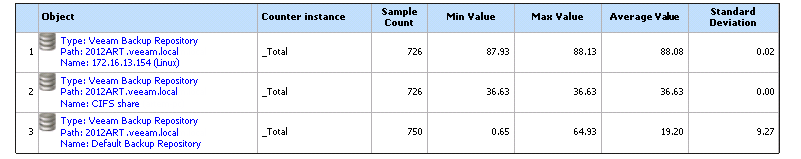
The table will display additional details for every repository: name, sample count, minimum, maximum and average free space usage values and standard deviation.