This is an archive version of the document. To get the most up-to-date information, see the current version.
Heatmap Dashboards
Heatmap dashboards compare two dimensions of performance metric values for objects and represent data as a heatmap. Heatmap objects are represented both by size of each heatmap tile, and by the color of each tile. Tiles are also grouped.
There are 2 heatmap dashboards available in the root Veeam Backup and Replication folder:
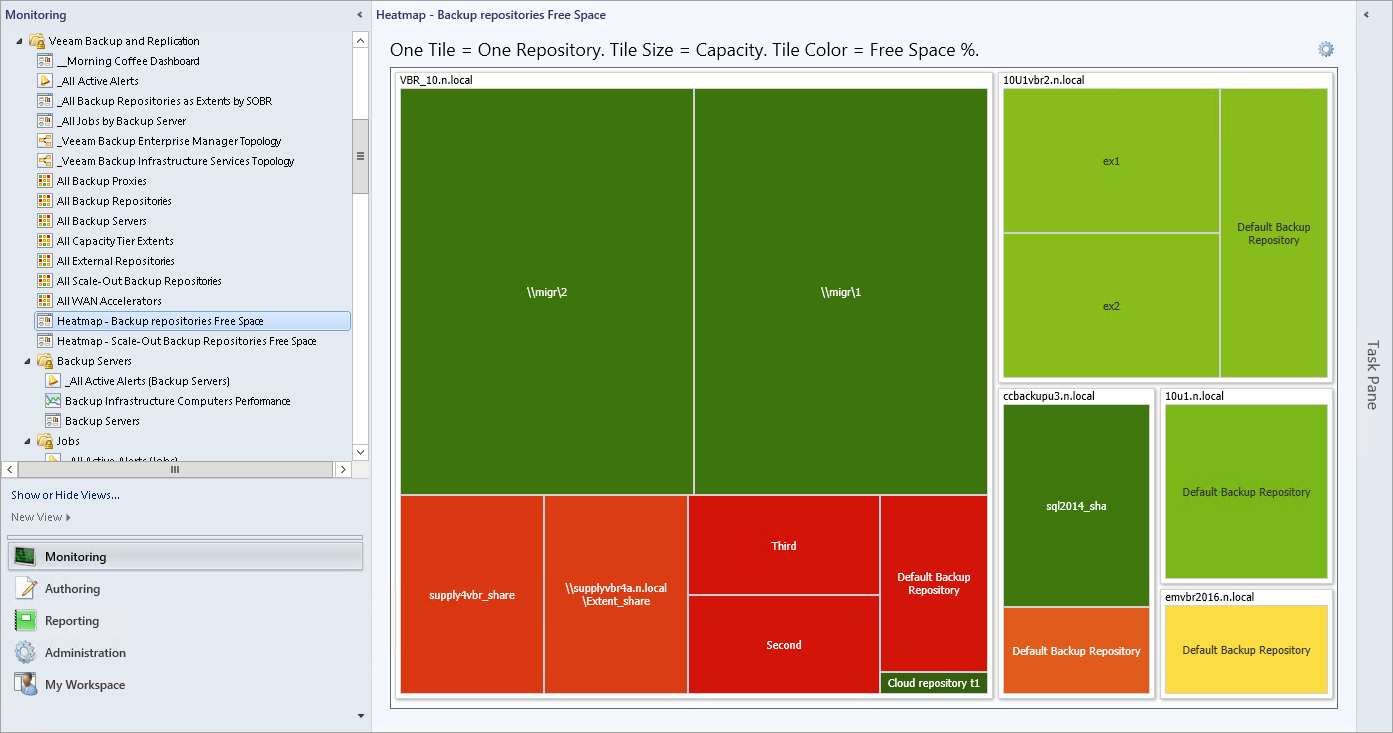
- Heatmap - Backup Repositories Free Space dashboard shows capacity (in GB) and free space (in percentage) for backup repositories.
- Heatmap - Scale-Out Backup Repositories Free Space dashboard shows capacity (in GB) and free space (in percentage) for scale-out backup repositories and their extents.
Example screenshot below shows the Heatmap - Backup Repositories Free Space dashboard. The size of each tile represents each repository capacity; and the color of the tile represents the % of free space.