 This is an archive version of the document. To get the most up-to-date information, see the current version.
Heatmap
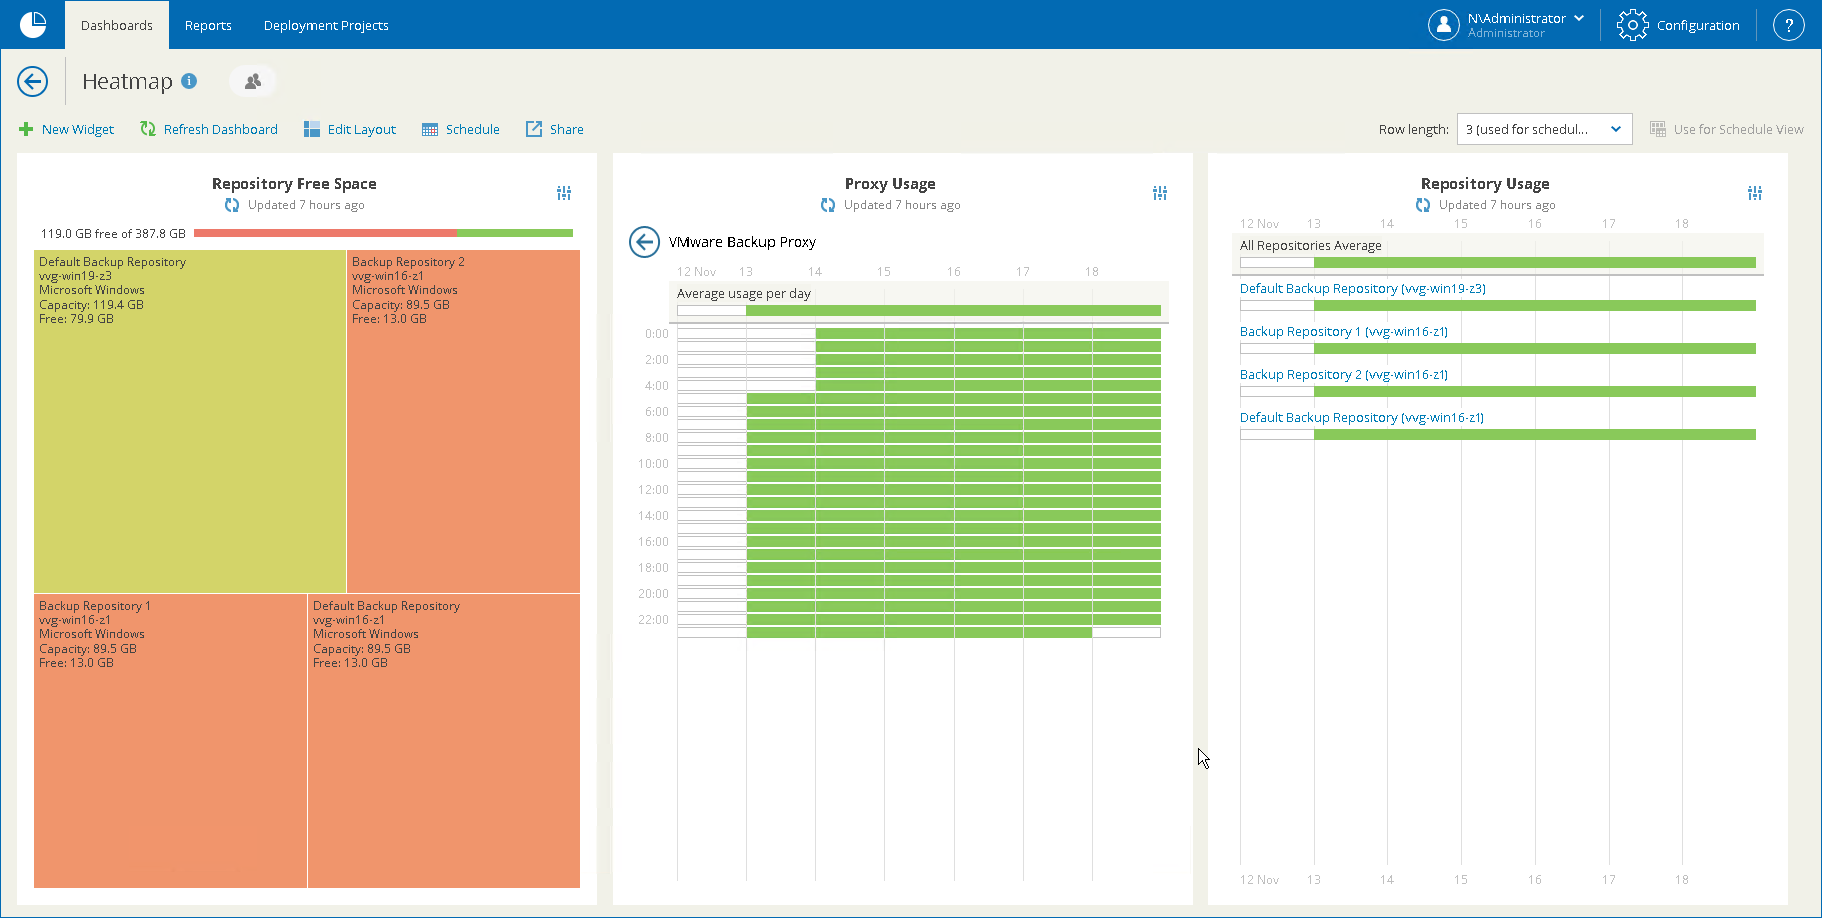
The Heatmap dashboard visually represents key resource utilization in your backup infrastructure. The dashboard allows real-time monitoring of free space on repositories as well as repository and proxy usage.
Widgets Included
- Repository Free Space
This widget shows the amount of total and free disk space on each of your backup repositories in a form of a treemap.
Each section of the treemap contains information about a single repository. To see detailed information, hover the pointer over a section. Color of a section is determined by the amount of free space relative to the total space: green color means repository disk space is mostly free while red color means repository disk space is mostly used.
Click a section associated with a scale-out repository to see detailed information about its extents.
- Proxy Usage
This widget shows concurrent tasks that backup proxy servers processed during the week.
Each row of the diagram contains information about a single proxy server.
To see details on hourly proxy server usage, click a row. In the section dedicated to a specific proxy server, each cell represents server activity during 1-hour time periods.
To open the section with detailed information about proxy server settings and activity during specific hour, click the cell. This section includes the following elements:
- Backup server — host name of the backup server.
- CPU count — number of CPU cores.
- Concurrent tasks limit — number of maximum concurrent tasks.
- Max concurrent tasks processed — configured number of concurrent tasks processed.
- CPU usage — CPU resources consumed, in percent.
- Memory usage — memory resources consumed, in percent.
- Related jobs — list of the concurrent jobs.
Color of a cell is determined by number of processed concurrent tasks relative to maximum number of concurrent tasks: green color means none or few concurrent tasks were processed while red color means number of concurrent tasks is close to or reaches maximum.
- Repository Usage
This widget shows concurrent tasks that backup repositories processed during the week.
Each row of the diagram contains information about a single repository.
To see details on hourly repository usage, click a row. In the section dedicated to a specific repository, each cell represents server activity during 1-hour time periods.
To open the section with detailed information about repository settings and activity during specific hour, click the cell. This section includes the following elements:
- Repository type — type of the repository.
- Backup server — host name of the backup server.
- Concurrent tasks limit — configured number of maximum concurrent tasks.
- Max concurrent tasks processed — number of concurrent tasks processed.
- Disk Bytes/sec — operation speed of the repository disk.
- Related jobs — list of the concurrent jobs.
Color of the section is determined by the number of processed concurrent tasks relative to the maximum number of concurrent tasks: green color means none or few concurrent tasks were processed while red color means the number of concurrent tasks is close to or reaches maximum.