Veeam Security Activities
The Veeam Security Activities dashboard displays aggregated information about security activities on your Veeam Backup & Replication and Veeam ONE servers.
By default, data is shown from all data source hosts. To filter data, you can select specific time period or data source host.
|
Note |
|
If there are no activities on a specific data source, it will not be displayed on the dashboard. |
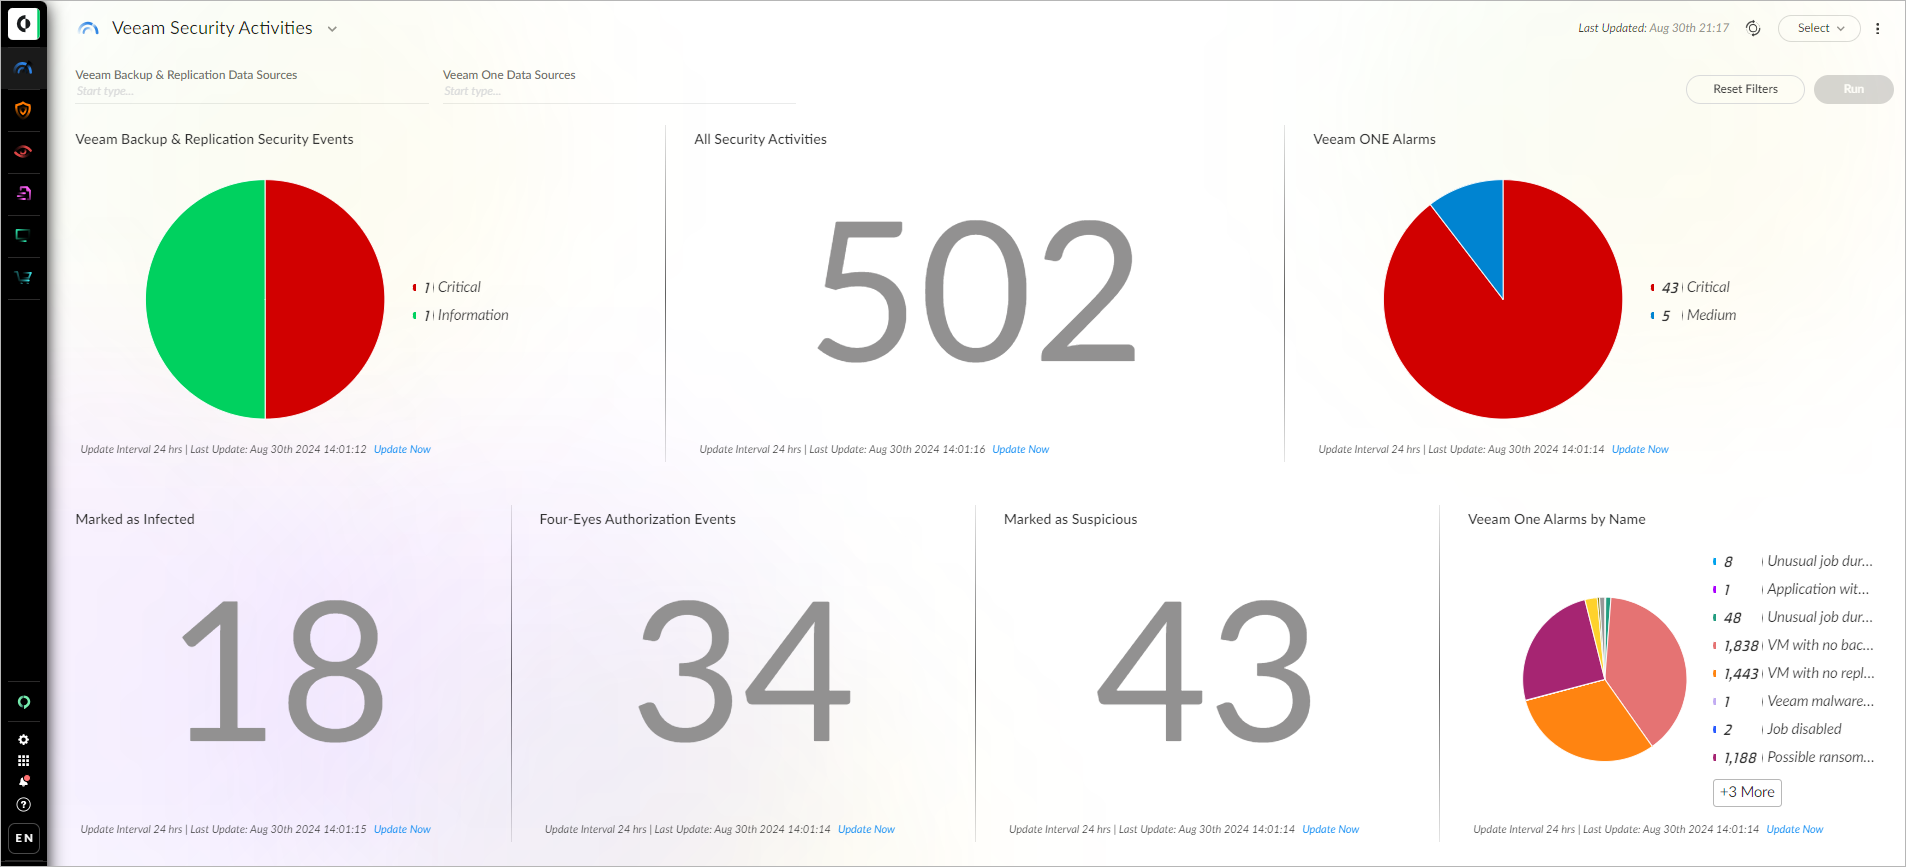
The dashboard includes the following widgets:
|
Widget |
Description |
|---|---|
|
All Security Activities |
The total amount of security activities including Veeam Backup & Replication security events and Veeam ONE alarms. By default, the widget displays data for the last 24 hours. |
|
Veeam Backup & Replication Security Events |
A pie chart displaying the breakdown of Veeam Backup & Replication security events by severity level. By default, the widget displays data for the last 30 days. |
|
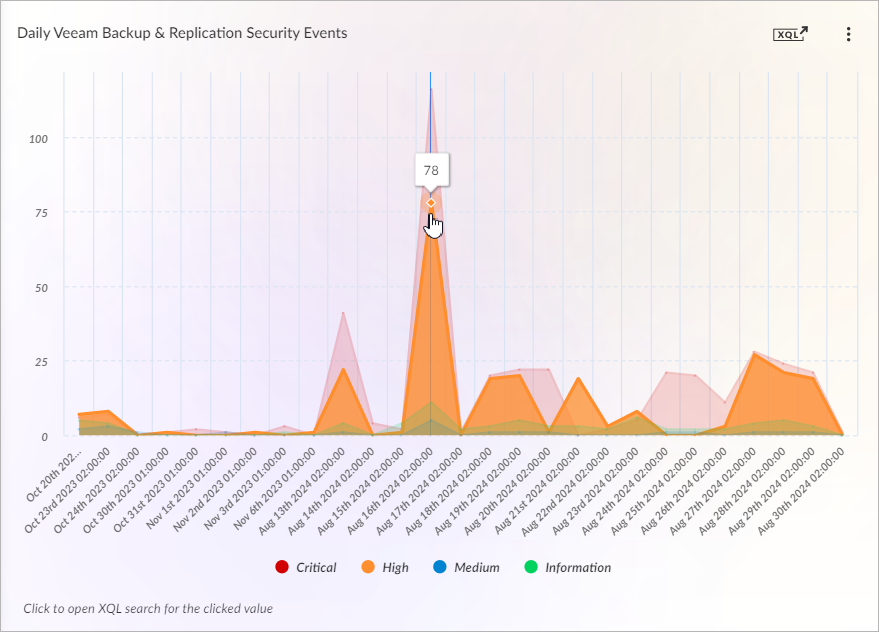
Daily Veeam Backup & Replication Security Events |
A colored graph displaying daily statistics on Veeam Backup & Replication security events by severity level. By default, the widget displays data for the last 7 days. |
|
Latest Veeam Backup & Replication Security Events |
A table displaying information about the latest security events triggered on each Veeam Backup & Replication server. By default, the widget displays data for the last 30 days. |
|
Marked as Infected |
The total amount of objects marked as Infected. For more information, see Malware Detection in the Veeam Backup & Replication User Guide. By default, the widget displays data for the last 24 hours. |
|
Marked as Suspicious |
The total amount of objects marked as Suspicious. For more information, see Malware Detection in the Veeam Backup & Replication User Guide. By default, the widget displays data for the last 24 hours. |
|
Four-Eyes Authorization Events |
The total amount of four-eyes authorization events. For more information, see Four-Eyes Authorization in the Veeam Backup & Replication User Guide. By default, the widget displays data for the last 24 hours. |
|
Four-Eyes Authorization Events by Operation |
A colored stacked bar chart displaying daily statistics on four-eyes authorization events by operation. By default, the widget displays data for the last 7 days. |
|
Veeam ONE Alarms |
A pie chart displaying the breakdown of Veeam ONE alarms by severity level. By default, the widget displays data for the last 30 days. |
|
Veeam ONE Alarms by Name |
A pie chart displaying the breakdown of Veeam ONE alarms by name. By default, the widget displays data for the last 30 days. |
|
Daily Veeam ONE Alarms |
A colored graph displaying daily statistics on Veeam ONE alarms by severity level. By default, the widget displays data for the last 7 days. |
|
Latest Veeam ONE Alarms |
A table displaying information about the latest alarms triggered on each Veeam ONE server. By default, the widget displays data for the last 30 days. |
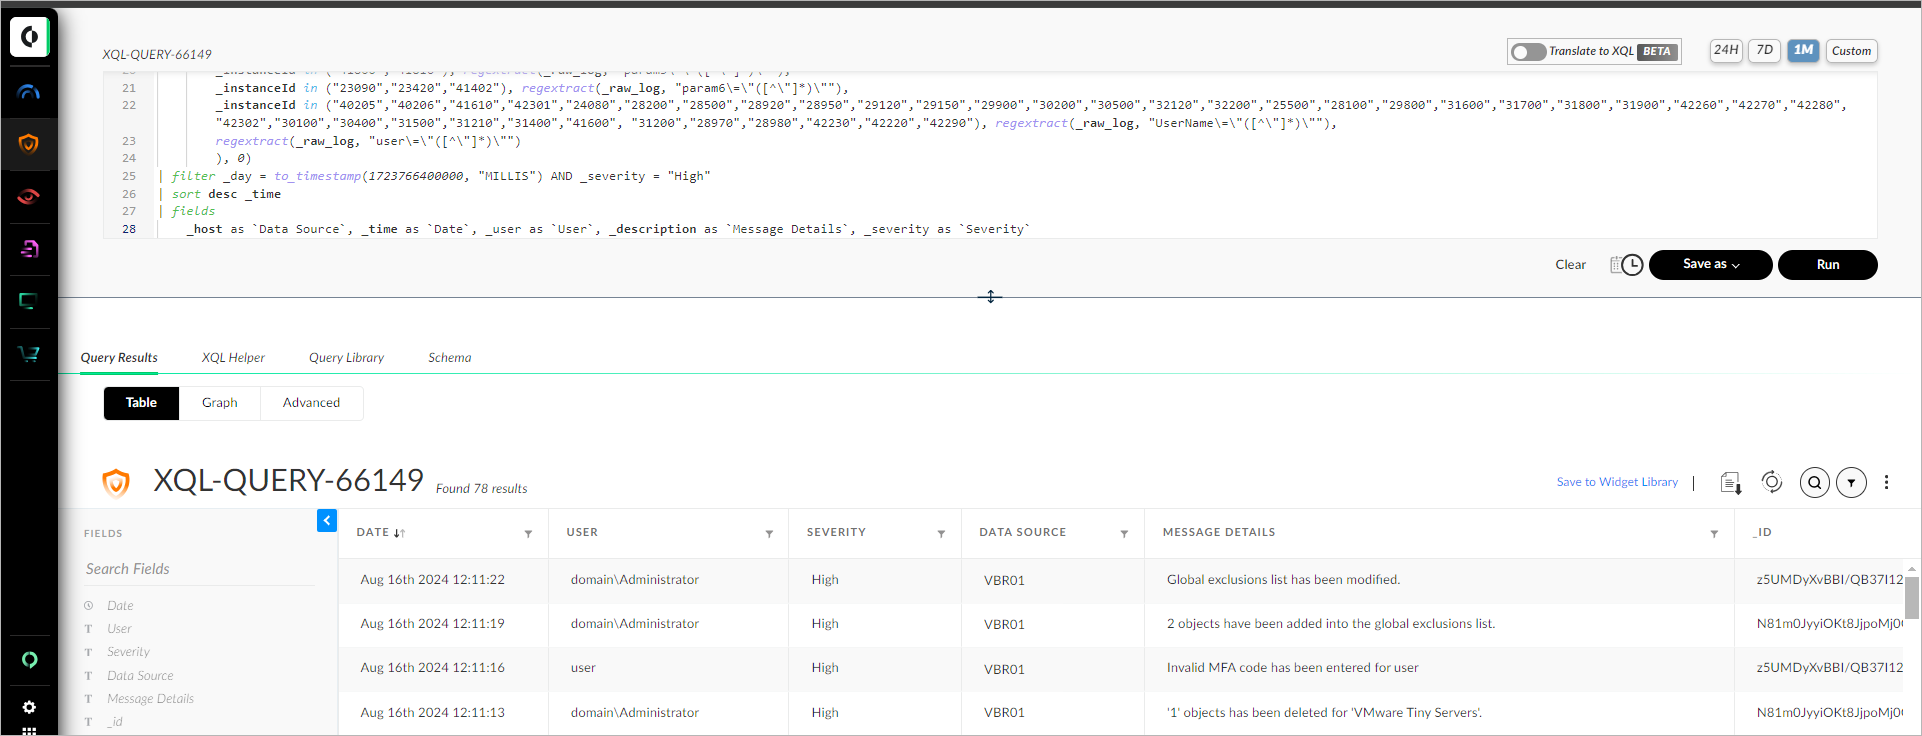
To view detailed information on specific data, hover the mouse over a value on the dashboard and click on it.
A new window with the search query will be opened.