
By default, all performance charts display data for the virtual infrastructure object selected in the inventory pane. You can also choose to display performance data on charts for:
- Child components or objects of the selected virtual infrastructure object (for example, all hosts in the cluster)
- Child VMs for the selected virtual infrastructure object or segment
To display performance data for direct children of the selected virtual infrastructure object:
- At the bottom of the inventory pane, click Infrastructure View.
- Select the necessary virtual infrastructure object.
- Go to the necessary performance chart.
- From the Chart options list, select Custom view.
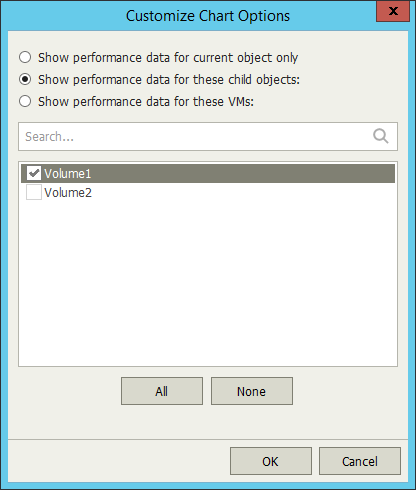
- In the Customize Chart Options window, choose Show performance data for these child objects.
- Select check boxes next to child objects that should be included in the chart scope.
- Click OK.
To display performance data for a set of VMs in the selected virtual infrastructure segment:
- In the inventory pane, select the necessary virtual infrastructure object.
- Go to the necessary performance chart.
- In the Chart options list, select Custom view.
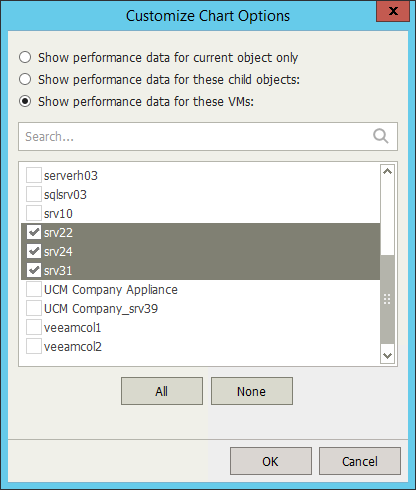
- In the Customize Chart Options window, choose Show performance data for these VMs.
You can select both direct and indirect children (children of children) of the selected virtual infrastructure object.
- Select check boxes next to VMs that should be included in the chart scope.
- Click OK.
|
The legend pane displays objects for which data is available for the selected time interval. |
Send feedback | Updated on 3/25/2016
