 This is an archive version of the document. To get the most up-to-date information, see the current version.
Summary
Veeam Service Provider Console includes the Summary dashboard that consolidates information about computers protected with Veeam backup agents, VMs and file shares protected with Veeam Backup & Replication, as well as details on the amount of cloud resources consumed by the company.
Required Privileges
To access this dashboard, a user must have one of the following roles assigned: Service Provider Global Administrator, Service Provider Administrator, Service Provider Operator, Service Provider User.
Accessing Summary Dashboard
To access the Summary dashboard:
- Log in to Veeam Service Provider Console.
For details, see Accessing Veeam Service Provider Console.
- In the menu on the left, click Summary.
- Use tabs at the top to open the necessary dashboard view:
The Overview dashboard consolidates information about managed client companies, including information about active alarms, managed Veeam backup agents and VMs, consumed cloud resources, invoices and revenue, and so on. This dashboard presents the big picture and serves as the starting point from which you can drill down to dashboards and views with further details.
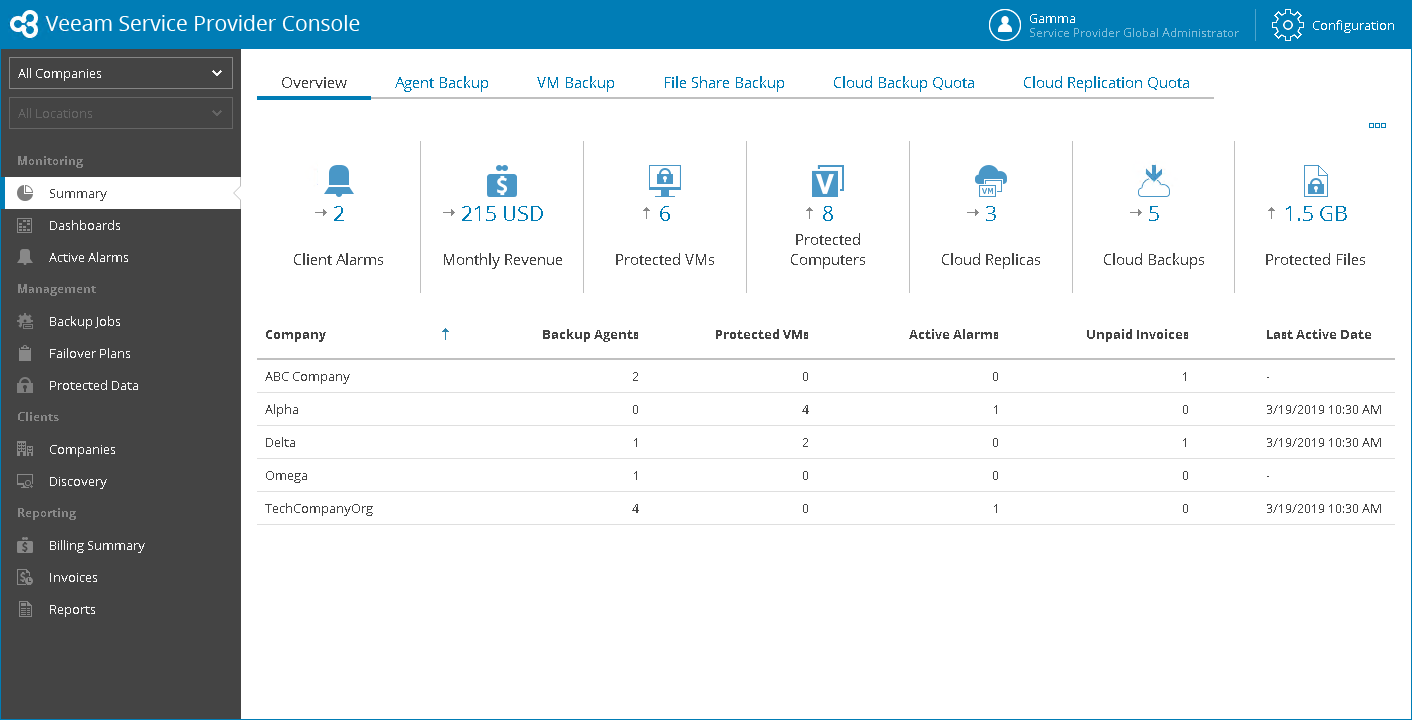
The dashboard includes a set of widgets and a details table.
- Client Alarms widget shows the number of unresolved warning and error alarms triggered for companies. The arrow next to the number shows how the number of alarms triggered for the current month changed compared to the number of alarms triggered within the previous month.
Click the widget to drill down to the list of active alarms. For details on working with alarms, see Viewing and Exporting Triggered Alarms.
- [For Service Provider Global Administrator, Service Provider Administrator, Service Provider Operator] Monthly Revenue widget shows the total revenue calculated in all paid invoices for the previous calendar month. The arrow next to the number shows how this figure changed compared to the revenue for the month prior to the previous month.
Click the widget to drill down to the billing summary. For details on the billing statistics, see Viewing and Exporting Invoice Details.
- Protected VMs widget shows the number of managed VMs that have backup or replica restore points. The arrow next to the number shows how the number of protected VMs changed compared to the number of protected VMs for the previous month.
Click the widget to drill down to the list of protected VMs for the chosen companies and locations. For details on protected VMs, see Virtual Machines.
- Protected Computers widget shows the number of managed Veeam backup agents. The arrow next to the number shows how the number of Veeam backup agents changed compared to the number of managed Veeam backup agents for the previous month.
Click the widget to drill down to the list of protected computers for the chosen companies and locations. For details on protected computers, see Viewing and Exporting Protected Computer Details.
- Cloud Replicas widget shows the number of managed VMs that have replica restore points. The arrow next to the number shows how the number of replica restore points changed compared to the number of replica restore points for the previous month.
Click the widget to drill down to the list of protected VMs for the chosen companies and locations. For details on protected VMs, see Virtual Machines.
- Cloud Backups widget shows the number of VMs and Veeam backup agents whose backups are stored on a cloud repository. The arrow next to the number shows how the number of cloud backups changed compared to the number of cloud backups for the previous month.
Click the widget to drill down to the list of protected VMs for the chosen companies and locations. For details on protected VMs, see Virtual Machines.
- Protected Files widget shows the size of files that have backup restore point. The arrow next to the number shows how the amount of protected files changed compared to the amount of protected files for the previous month.
Click the widget to drill down to the list of protected file shares, for the chosen companies and locations. For details on protected file shares, see File Shares.
The details table provides a set of metrics for the chosen company. By default, some metrics in the list are hidden. To display additional metrics, click the ellipsis on the right of the list header and choose metrics that must be displayed.
- Company — company name.
- Site — name of the Veeam Cloud Connect site on which the company is registered.
- Backup Agents — number of managed Veeam backup agents.
- Protected VMs — number of VMs that have backups or replicas for the previous month.
- Managed Workstations — number of managed Veeam backup agents whose job is configured to run in the Workstation operation mode.
- Managed Servers — number of managed Veeam backup agents whose job is configured to run in the Server operation mode.
- VMs in Cloud Repository — number of VMs stored in backups in cloud repositories.
- Agents in Cloud Repository — number of Veeam backup agents stored in backups in cloud repositories.
- Used Storage Quota — amount of consumed space in cloud repositories, as a percentage of total allocated cloud repository space.
- Traffic Quota — amount of data downloaded from cloud repositories during the billing period, as a percentage of data transfer out quota.
The billing period is the period since the latest invoice was generated.
- Active Alarms — number of unresolved alarms triggered for companies.
- File Shares — number of managed file shares.
- Protected Files — size of files that have backups for the previous month.
- Unpaid Invoices — number of invoices with the Unpaid status.
- Total Paid — amount of costs paid by a company since the date when the company account was registered in Veeam Service Provider Console.
The total paid amount is calculated based on invoices with the Paid status.
- Jobs — number of jobs configured on managed Veeam Backup & Replication servers.
- Last Active Date — date and time when a connection was last established between Veeam Service Provider Console and a company.
- N. of Users — number of portal users created for a company. For details, see Managing Portal Users.
- Money to Pay — total amount the client needs to pay, that is, the total amount calculated based on invoices with the Unpaid status.
- Protected Agents — number of managed Veeam backup agents.
The Agent Backup dashboard view provides summary information about computers protected with Veeam backup agents. A protected computer is a computer that has at least one backup restore point.
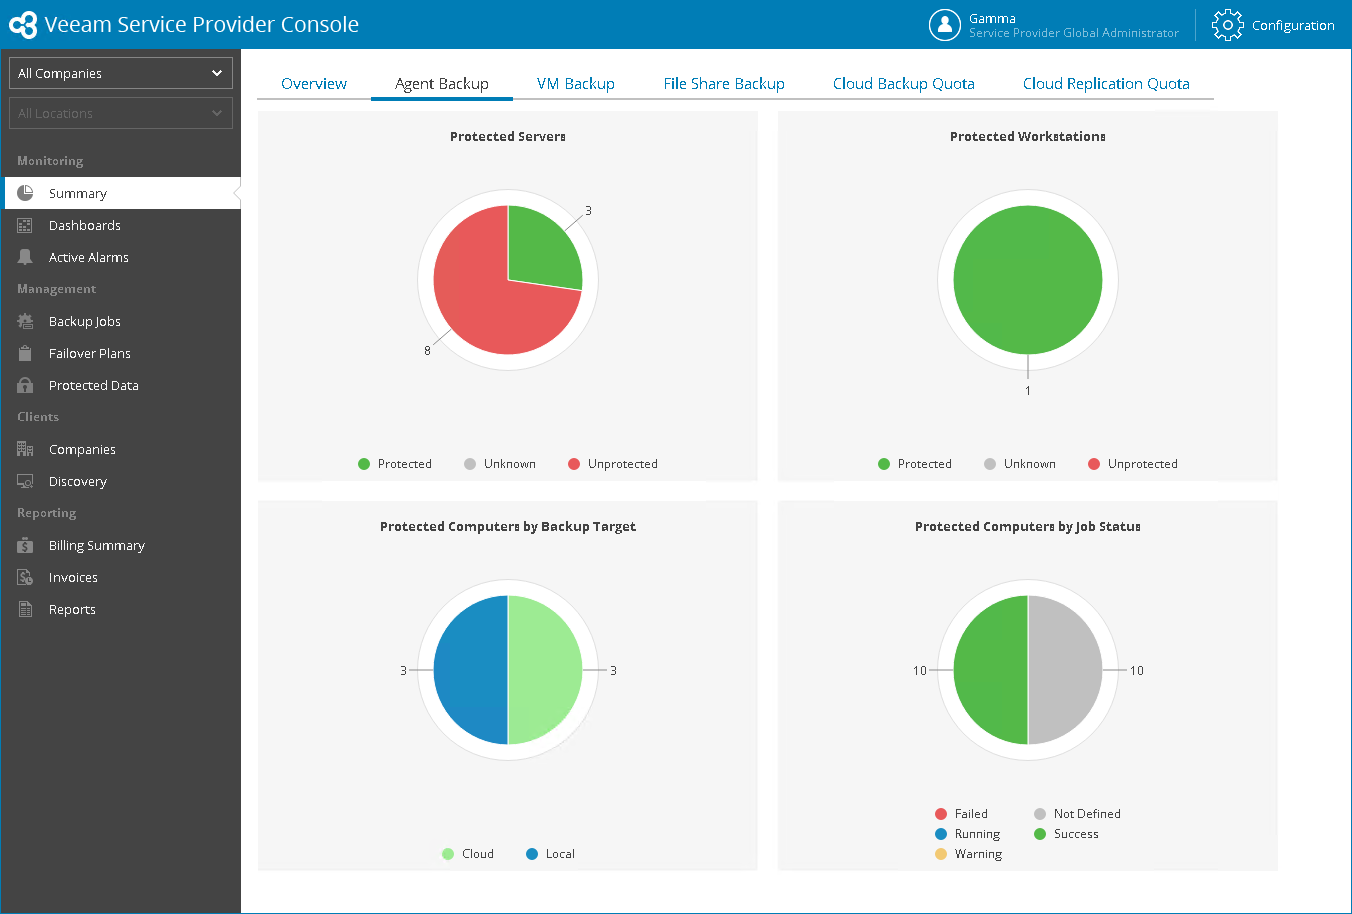
The dashboard view includes the following widgets:
- Protected Servers widget shows the number of computers that run Veeam backup agents in the Server mode and have at least one backup restore point. The widget details the status of the latest Veeam backup agent job session, and shows how many job sessions completed successfully, or ended up with warnings or errors.
- Protected Workstations widget shows the number of computers that run Veeam backup agents in the Workstation mode and have at least one backup restore point. The widget shows the status of the latest Veeam backup agent job session, and shows how many job sessions completed successfully, or ended up with warnings or errors.
- Protected Computers by Backup Target widget shows types of target locations on which backups of protected computers are stored. The widget details how many Veeam backup agents store their backups locally or on cloud repositories.
- Protected Computers by Job Status widget shows number of job sessions finished with different results. The widget details how many jobs finished successfully, finished with warning or failed.
The VM Backup dashboard view provides summary information about VMs protected with Veeam Backup & Replication. A protected VM is a VM that has a backup or replica restore point.
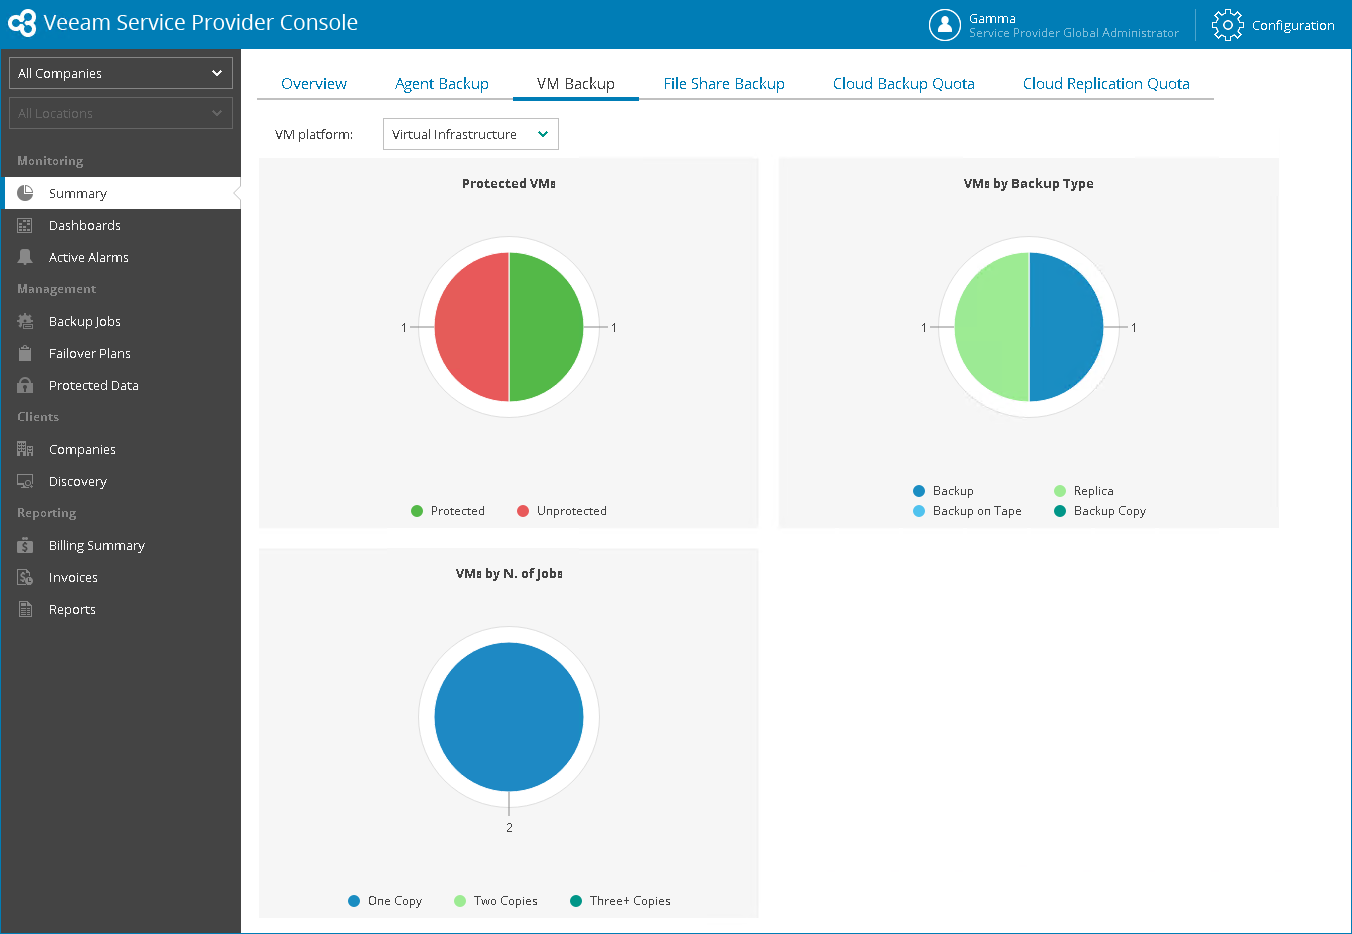
You can use the VM Platform filter at the top of the dashboard to view details on VMs in your virtual infrastructure and in public cloud.
The dashboard view includes the following widgets:
- Protected VMs widget shows the number of protected and unprotected VMs.
- VMs by Backup Type widget shows how many VMs in your virtual infrastructure are protected with backup, tape backup, backup copy and replication jobs and how many VMs in public clouds are protected with snapshots, remote snapshots and backup, tape backup and backup copy jobs.
- VMs by N. of Jobs widget shows how many protected VMs have backup copies. The widget chart details the number of protected VMs that have one backup copy, two backup copies and three and more backup copies.
The File Share Backup dashboard view provides summary information about file shares protected with Veeam Backup & Replication. A protected file share is a file share that has a backup restore point.
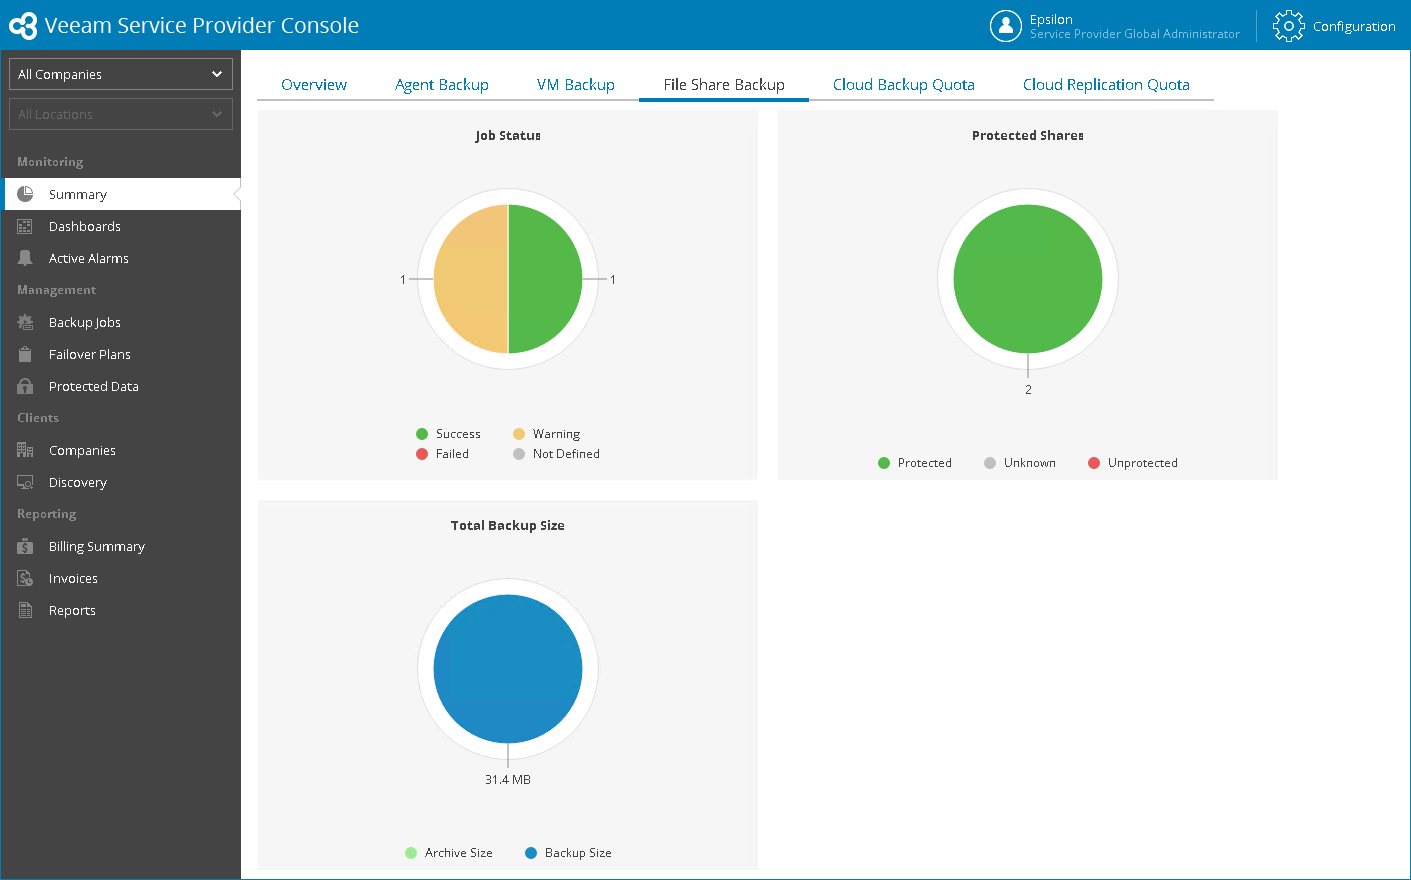
The dashboard view includes the following widgets:
- Job Status widget shows the number of file share backup jobs. The widget details the status of the latest Veeam Backup & Replication job sessions that protect the file shares, and shows how many job sessions completed successfully, or ended up with warnings or errors.
- Protected Shares widget shows how many file shares are protected with backup jobs.
- Total Backup Size widget shows the amount of data stored in backup and archive repositories.
The Cloud Backup Quota dashboard view provides information about cloud repository resources allocated for the company, used and remaining cloud resources.
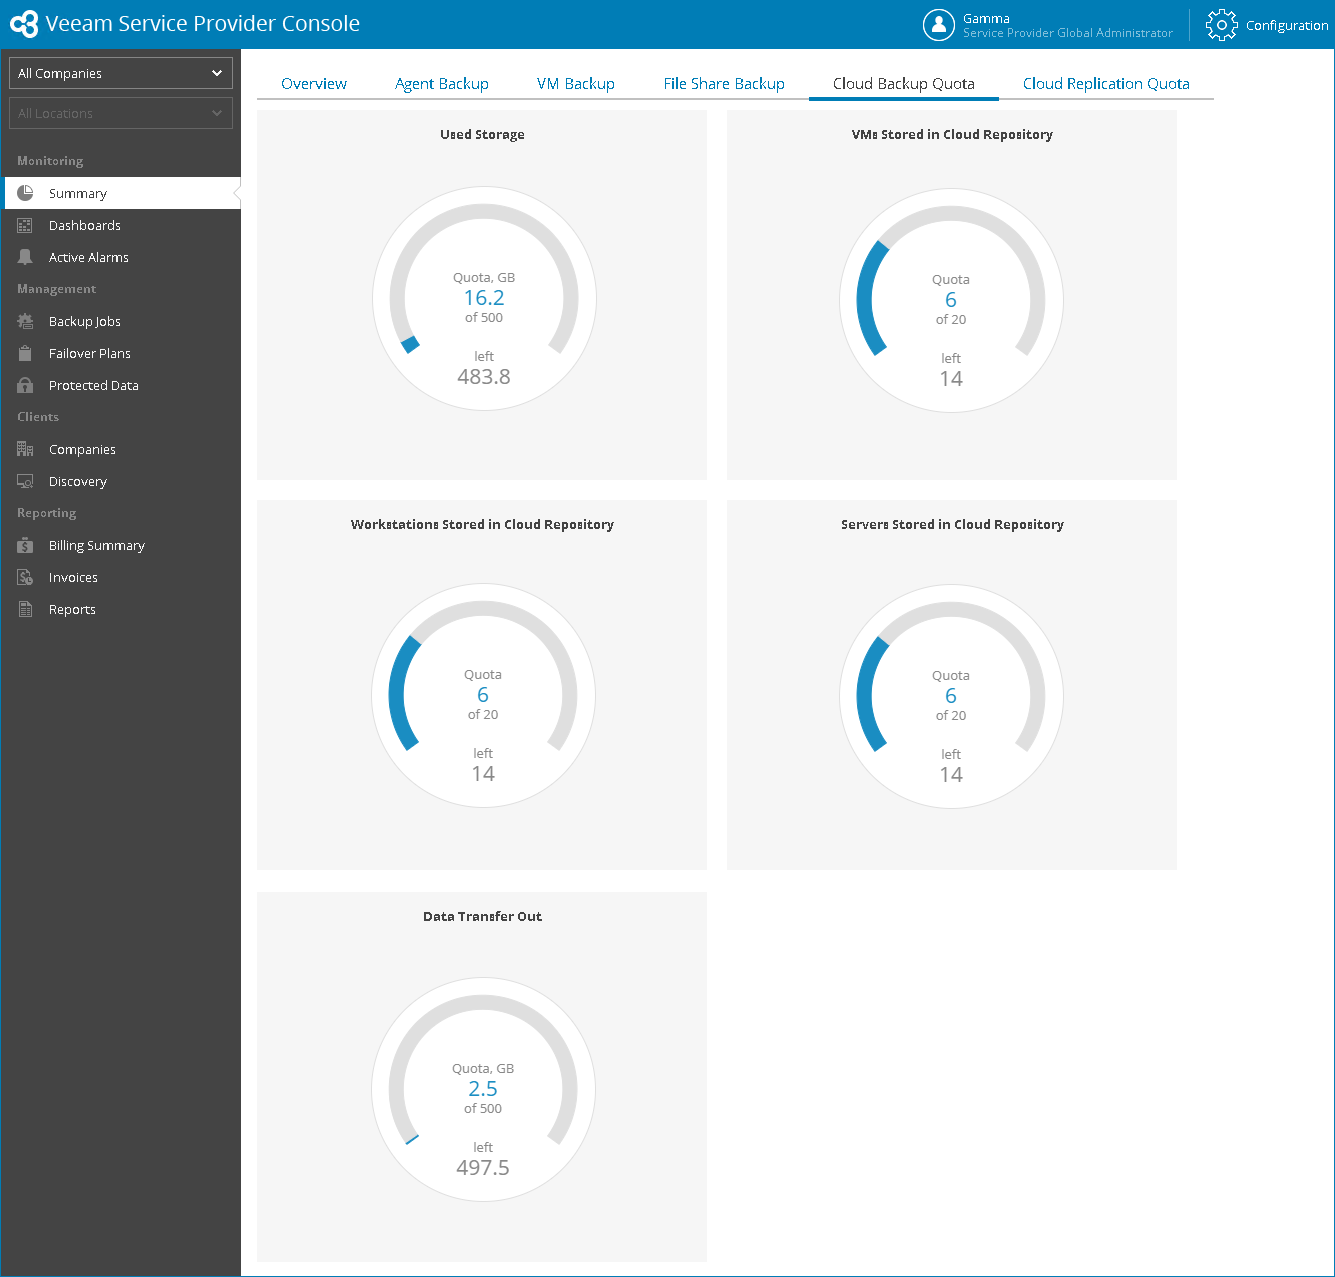
The dashboard view includes the following widgets:
- Used Storage widget shows the amount of space allocated for the company on all cloud repositories, the amount of used and remaining space.
- VMs Stored in Cloud Repository widget shows the VM quota set for the company by the service provider, the number of VMs already stored in cloud repositories, and the remaining VM quota.
- Workstations Stored in Cloud Repository widget shows the workstation quota set for the company by the service provider, the number of workstations already stored in cloud repositories, and the remaining workstation quota.
- Servers Stored in Cloud Repository widget shows the server quota set for the company by the service provider, the number of servers already stored in cloud repositories, and the remaining server quota.
- Data Transfer Out widget shows the data transfer out quota set for the company by the service provider, the amount of data already downloaded from cloud repositories during the current billing period (length of time between two successive invoices), and the remaining data transfer out quota.
The Cloud Replication Quota dashboard view provides information about cloud host resources allocated for the company, used and remaining cloud resources.
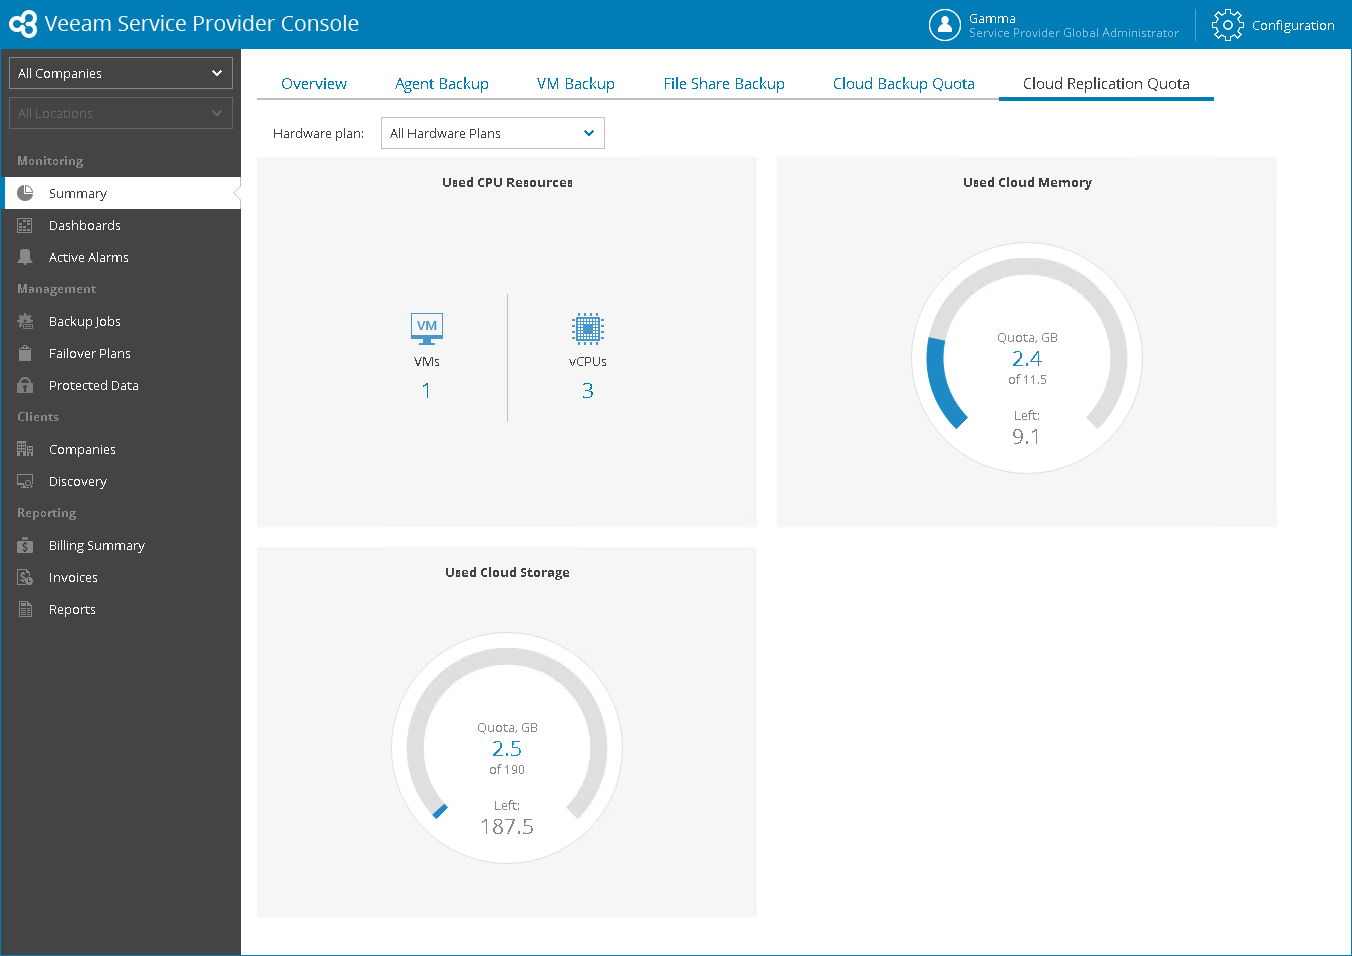
The dashboard view includes the following widgets:
- Used CPU Resources widget shows the number of configured vCPUs, and the number of cloud VM replicas on which these vCPUs are configured.
By default, the widget shows information for all hardware plans by which the company is subscribed. To choose a specific hardware plan, use the list at the top of the widget.
- User Cloud Memory widget shows the amount of memory allocated for cloud VM replicas, the amount of already used memory, and the remaining memory.
- Used Cloud Storage widget shows the amount of cloud storage space allocated for the company cloud VM replicas, the amount of used and remaining space.