Working with Veeam Incident Dashboard
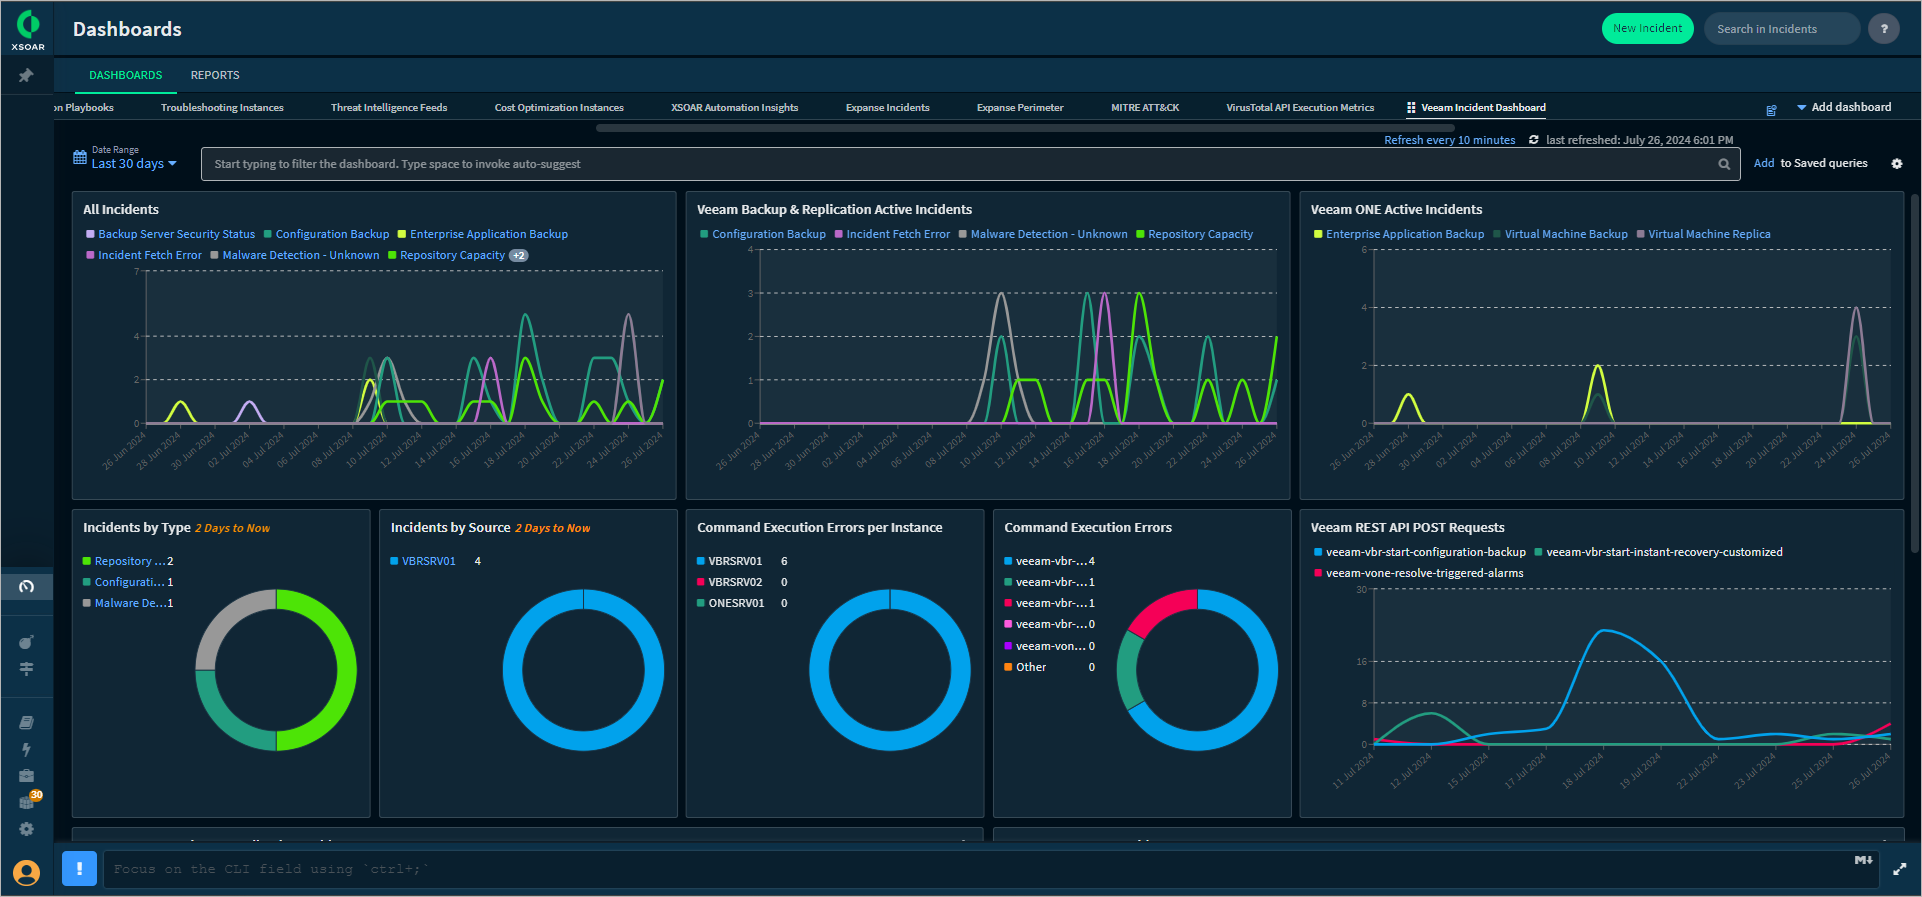
The Veeam Incident Dashboard displays aggregated information about incidents related to your Veeam Backup & Replication and Veeam ONE integration instances. Specific widgets also display incidents related to integration health state.
Adding Dashboard
To start using the dashboard, you need to add it to your workspace. To do this, perform the following steps:
- In the main menu, click Dashboards & Reports.
- On the Dashboards tab, click Add dashboard and select the dashboard from the list.
Dashboard Details
The dashboard includes the following widgets:
Widget | Description |
|---|---|
All Incidents | A colored graph displaying daily statistics on the following incidents:
|
Veeam Backup & Replication Active Incidents | A colored graph displaying daily statistics on Veeam Backup & Replication active incidents. If the incident is closed, it disappears from the graph. |
Veeam ONE Active Incidents | A colored graph displaying daily statistics on Veeam ONE active incidents. If the incident is closed, it disappears from the graph. |
Incidents by Type | A pie chart displaying the breakdown of incidents by type. Note that data is shown for the last 2 days. |
Incidents by Source | A pie chart displaying the breakdown of incidents by source. Note that data is shown for the last 2 days. |
Command Execution Errors per Instance | A pie chart displaying the breakdown of command execution errors by integration instance. |
Command Execution Errors | A pie chart displaying the breakdown of command execution errors by name. |
Veeam REST API POST Requests | A colored graph displaying daily statistics on POST requests sent to Veeam REST APIs. |
Latest Veeam Backup & Replication Incidents | A table displaying information about the latest incidents on each Veeam Backup & Replication integration instance. |
Latest Veeam ONE Incidents | A table displaying information about the latest incidents on each Veeam ONE integration instance. |
By default, data is shown for the last 7 days. To filter data, you can specify another time period.
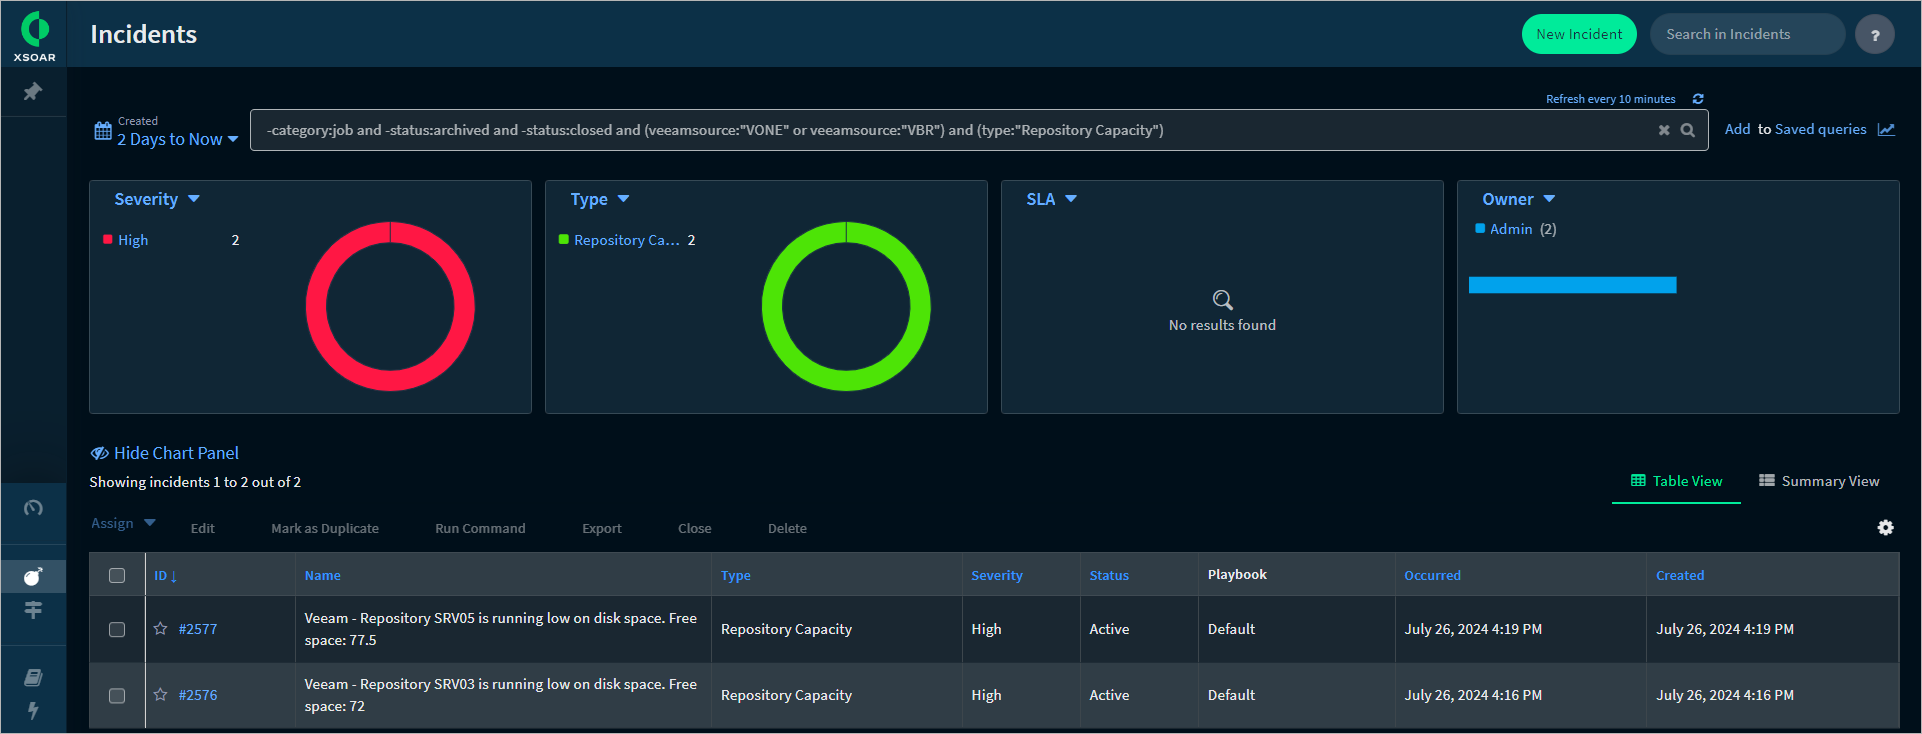
To view detailed information on specific data, do the following:
- For pie charts or colored graphs, click on the category.
- For tables, click on the incident ID in the ID column.
A new window with the search query will be opened.


