This is an archive version of the document. To get the most up-to-date information, see the current version.
Veeam Morning Coffee Dashboard for Hyper-V
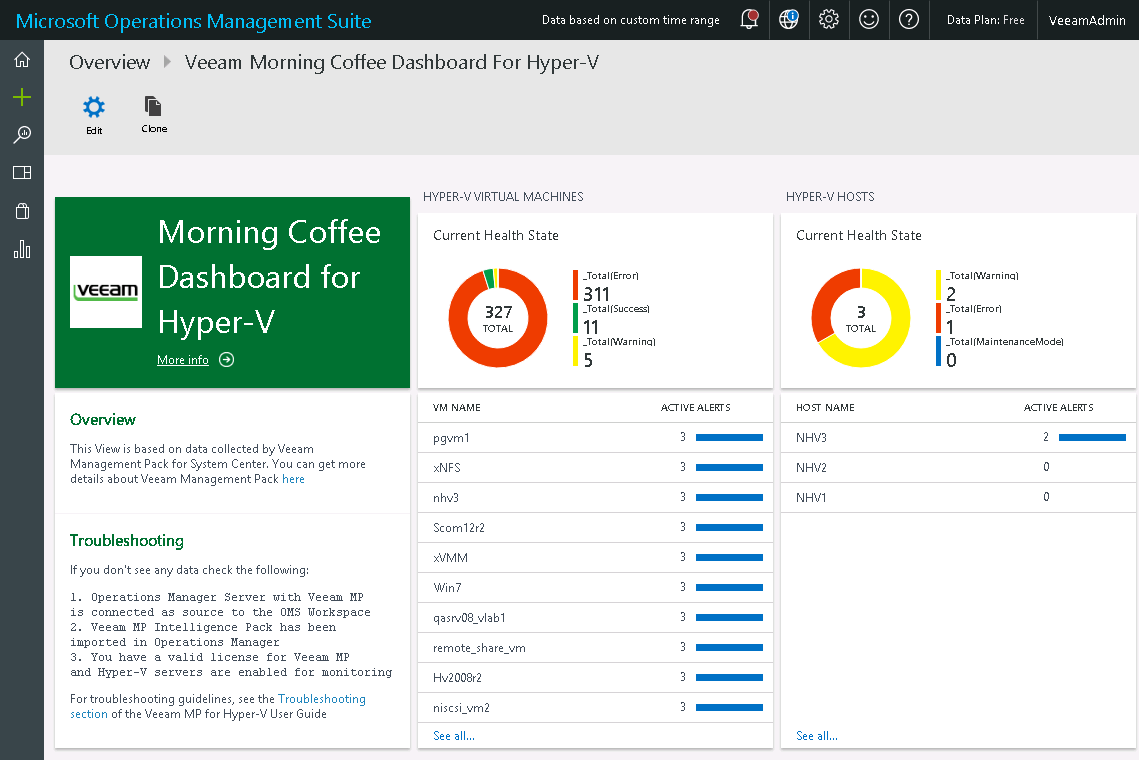
The dashboard uses data collected from the Ops Mgr to monitor the state of SCVMMs (if present), physical hosts, clusters, VMs, storage, and to track overall resource utilization for these objects:
- The Current Health State donut charts represent health state of monitored Hyper-V infrastructure objects and show the total number of objects in the ‘Success’, ‘Warning’, 'Error’, 'MaintenanceMode', 'UnAvailable' and 'Uninitialized' states.
The Active Alerts table under each chart displays the total number of active alerts currently raised for objects in the ‘Warning’ and 'Error’ states. To get more information on the alerts, click a line in the table.
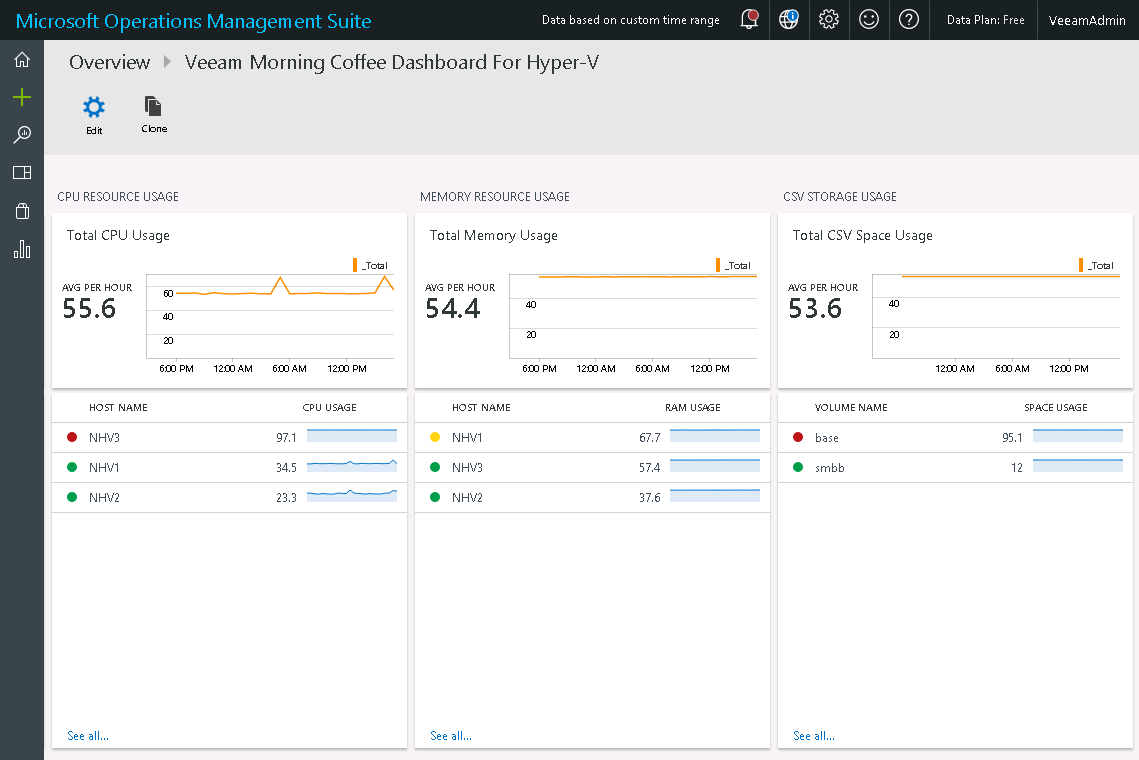
- The Resource Usage performance charts represent per-hour resource utilization for the discovered virtual infrastructure.
The Resource Usage table under each chart displays the current resource utilization value for each monitored object. The state icon of the object will depend on whether its resource usage threshold has been breached.
To get performance details, you can click either the performance chart, or a line in the table.