This is an archive version of the document. To get the most up-to-date information, see the current version.
Monitoring with Veeam Integration Pack for Operations Management Suite
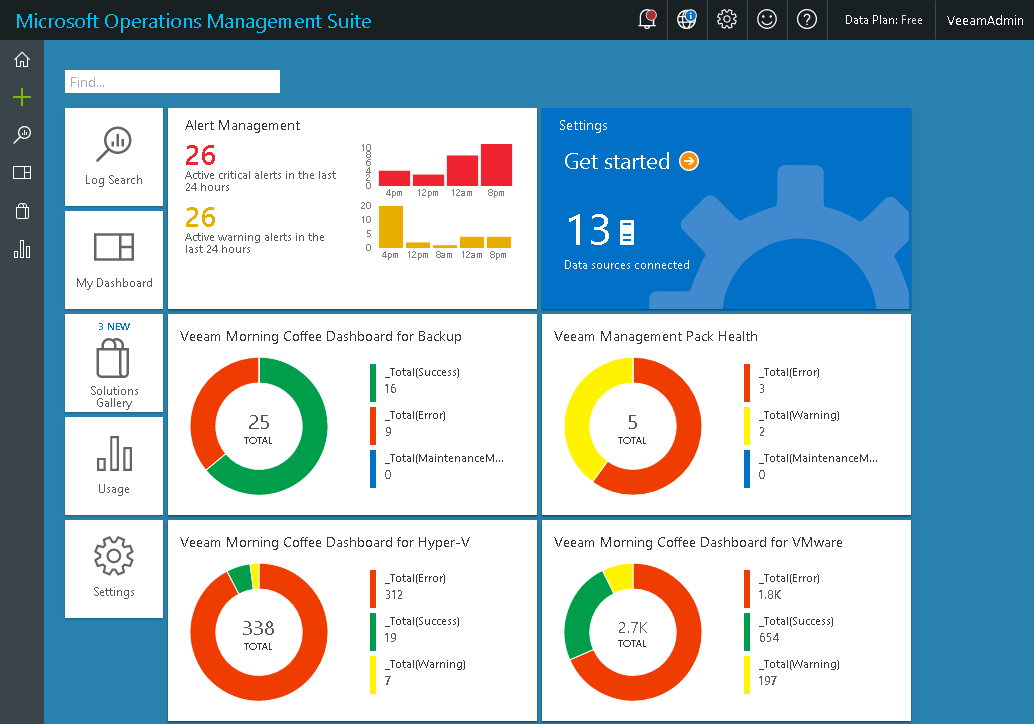
The _Morning Coffee Dashboards are the first thing to see once you get to work. These dashboards track the state of monitored objects, estimate the overall resource utilization and immediately display these changes to provide at-a-glance real-time overview of your infrastructure.
As soon as you import 4 Veeam OMS views into the OMS workspace, the following dashboards will become available at the Microsoft OMS Home tab:
- Veeam Morning Coffee Dashboard for VMware
- Veeam Morning Coffee Dashboard for Hyper-V
- Veeam Morning Coffee Dashboard for Backup
- Veeam Management Pack Health
The colored donut charts in these dashboards show the total number of discovered virtual infrastructure objects in the ‘Success’, ‘Warning’ and 'Error’ states. Click a dashboard to get more information on unhealthy objects and alerts raised for these objects.