
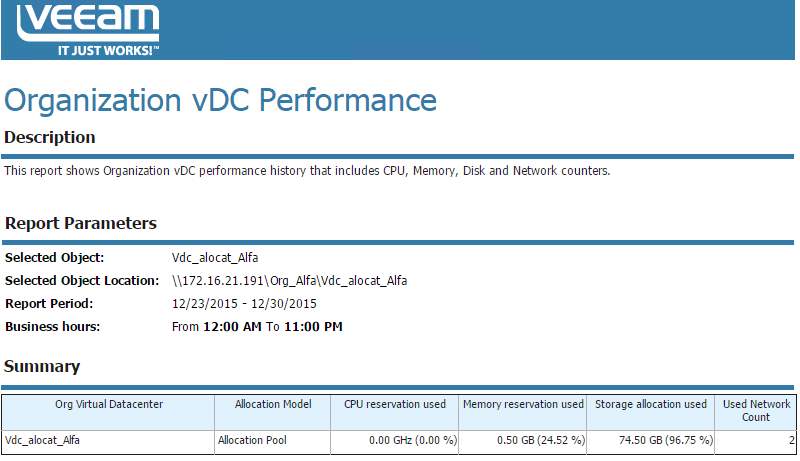
This report aggregates historical data and shows performance statistics for a selected organization virtual datacenter across a time range.
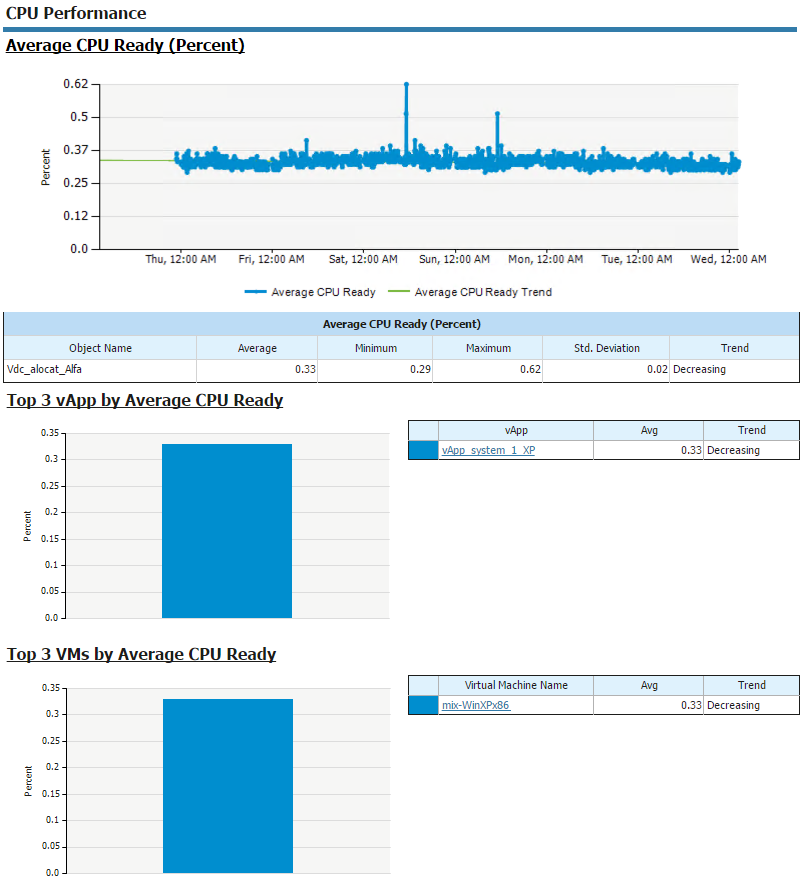
The report shows performance charts with statistics on CPU, memory, disk and network usage for the organization virtual datacenter, lists top resource consuming vApps and VMs, and calculates resource usage trends for them.
|
|
Use Case
The report helps you identify organization virtual datacenters with performance issues, right-size resource provisioning and eliminate potential performance bottlenecks.
Report Parameters
Object: defines the organization virtual datacenter to analyze in the report.
Interval/Start Date - End Date: defines the time period to analyze in the report.
Top N: defines the maximum number of vApps and VMs to display in the report output.
Business hours from - to: defines time of a day for which historical performance data will be used to calculate the performance trend. All data beyond this interval will be excluded from the baseline used for data analysis.
