 This is an archive version of the document. To get the most up-to-date information, see the current version.
Reviewing Dashboards
Veeam ONE Reporter dashboards provide an overall view of the managed infrastructure. Every dashboard includes a set of widgets. Widgets are visual modules that portray various aspects of the managed environment in the form of charts, graphs or tables. By aggregating several widgets on a single screen, dashboards allow you to focus on critical areas of the managed environment, track dependencies and interrelated aspects.
Veeam ONE Reporter dashboards are available in the Dashboards section. For this scenario, you will review the Veeam Backup & Replication dashboard which provides information on the state of the key backup infrastructure components.
To open the Veeam Backup & Replication dashboard:
- Open Veeam ONE Reporter.
For more information, see Accessing Veeam ONE Reporter.
- Open the Dashboard tab.
- Do one of the following:
- Click the Veeam Backup & Replication dashboard preview image.
- Open the menu at the top right corner of the Veeam Backup & Replication dashboard and click View dashboard.
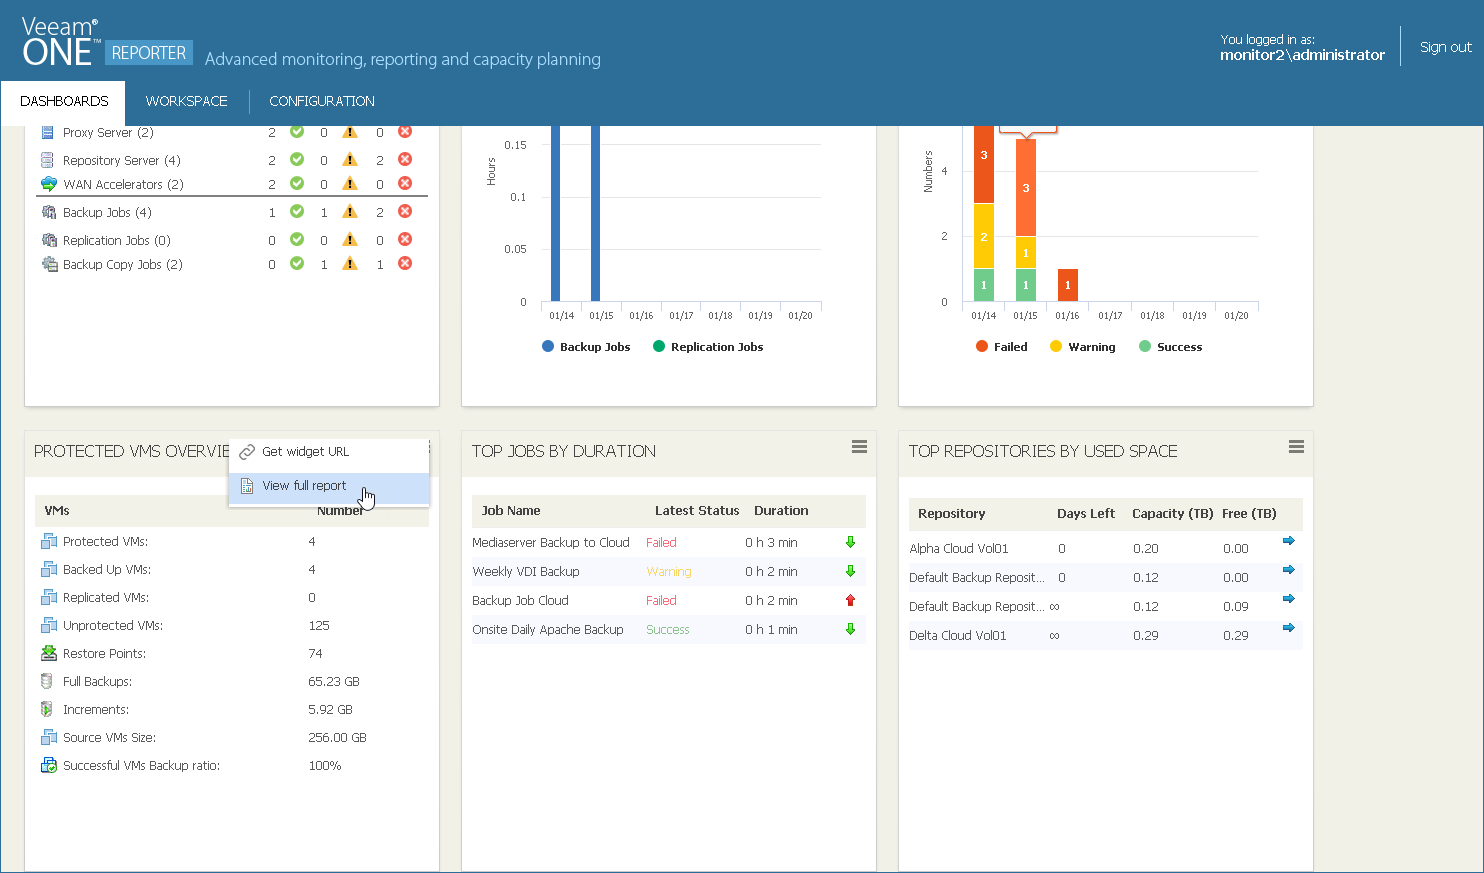
The Veeam Backup & Replication dashboard includes the following widgets:
- Backup Infrastructure Inventory. This widget shows the types of objects in your backup infrastructure, the number and health states of objects of each type.
- Backup Window. This widget shows the total duration of daily backup and replication job sessions.
- Jobs Status. This widget displays information on successfully completed jobs (daily) and the number of jobs that completed with warnings and errors (weekly).
- Protected VMs Overview. This widget displays counters for VMs protected with backup and replication jobs.
- Top Jobs by Duration. This widget displays 10 jobs with the longest duration, job completion status and the average weekly duration.
Arrows on the right show how job duration has changed over the previous week. A blue arrow pointing right next to the Duration value means that duration of the job has not changed over the past week, a green arrow pointing down means that job duration has decreased, while a red arrow pointing up means that job duration has increased.
- Top Repositories by Used Space. This widget displays 10 repositories that will run out of free space sooner than other repositories, as well as total capacity and free space left on these repositories. The widget also forecasts how many days remain before the repositories will run out of free space.
Arrows on the right show how the repository free space value has changed over the previous week. They have similar meanings to those in the Top Jobs by Duration widget.
Most widgets represent information associated with the respective report. For example, the Protected VMs Overview widget is based on the Protected VMs report. You can generate a corresponding report to analyze data in a more detailed way or with different parameters.
To generate the Protected VMs report:
- From the menu at the top right corner of the Protected VMs Overview widget, select View full report. The Drill Down Report window will open.
- Change the settings as in the Generating Protected VMs Report section if needed.
- In the Actions pane on the right, click Create report.
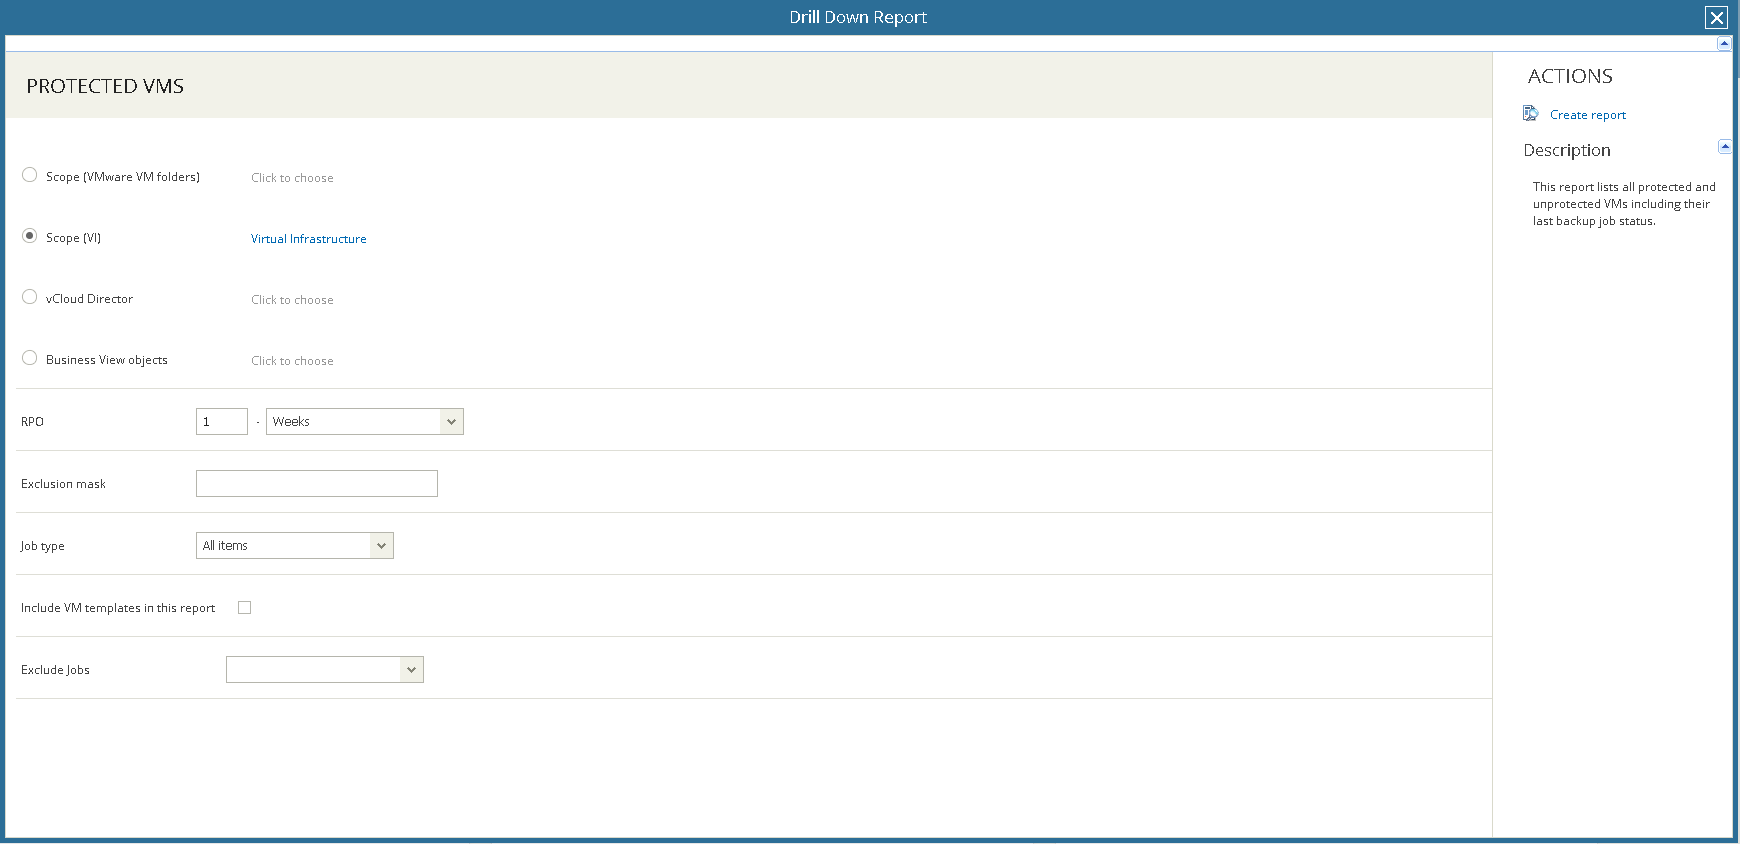
Note that all the changes you apply in the Drill Down Report window will not be implemented in the widget.
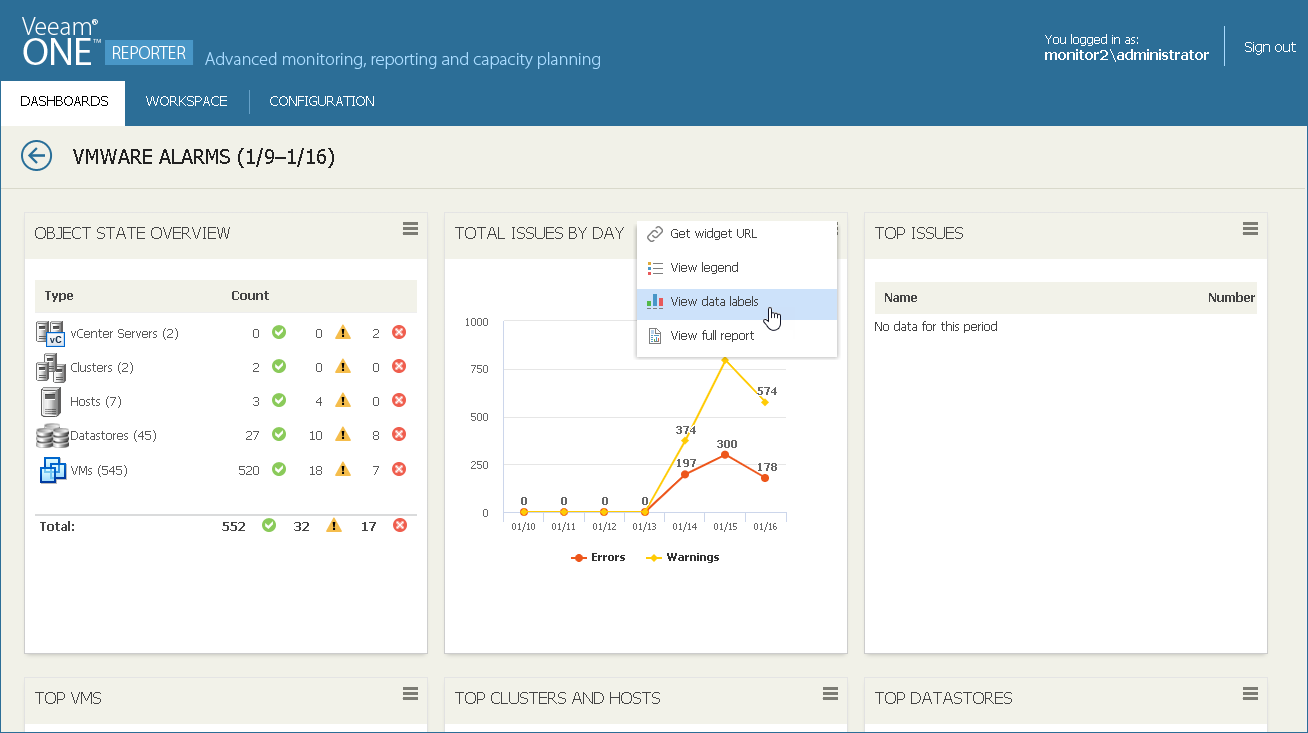
For some widgets, you can change display options. To do so, open the menu at the top right corner of the widget and select whether you want to display the legend below the chart or view data labels in the chart.
- To hide or show the chart legend, click View legend.
- To hide or view data labels on the chart, click View data labels. Note that this option is available for dashboards with 1 or 2 column layout.
More Information
For more information about dashboards, see section Dashboards of the Veeam ONE Reporter User Guide and section Predefined Veeam ONE Dashboards of the Veeam ONE Reporter User Guide.