 This is an archive version of the document. To get the most up-to-date information, see the current version.
Microsoft Hyper-V Infrastructure Summary
The Hyper-V infrastructure summary dashboard provides the health state overview for the selected virtual environment segment.
The dashboard is available for the following infrastructure levels:
- Virtual infrastructure (root node)
- Virtual infrastructure container (such as SCVMM, cluster or storage container)
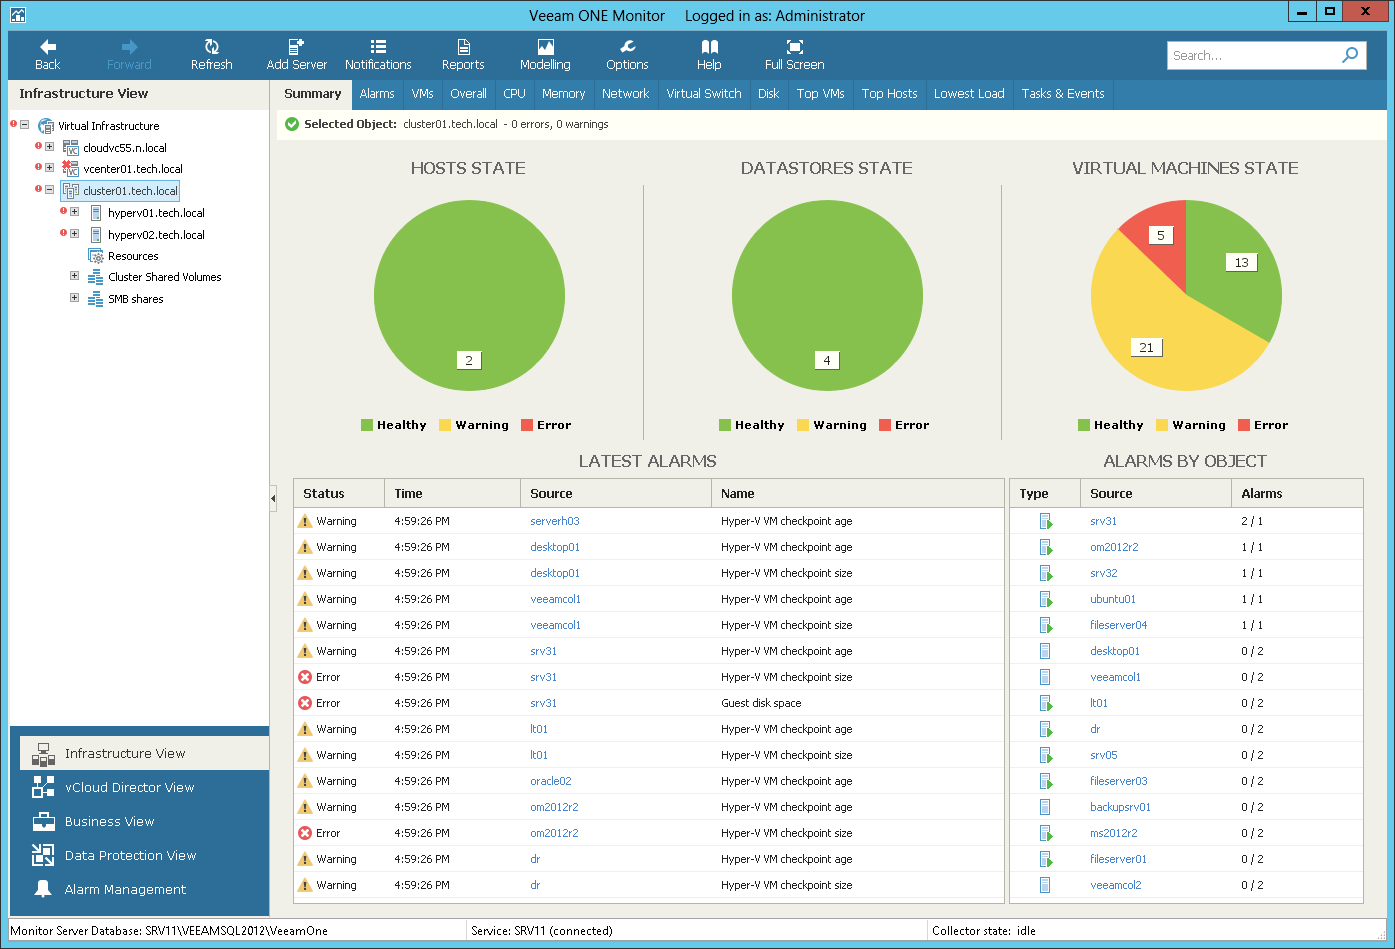
Host State, Datastores State, Virtual Machines State
The charts reflect the state of virtual infrastructure objects. Every chart segment represents the number of objects in a certain state — objects with errors (red), objects with warnings (yellow) and healthy objects (green). Click a chart segment or a legend label to drill down to the list of alarms with the corresponding status for the selected type of virtual infrastructure objects.
Latest Alarms
The list displays the latest 15 alarms that were triggered for objects in the selected virtual environment segment. Click a link in the Source column to drill-down to the list of alarms triggered for a specific virtual infrastructure object.
Alarms by Object
The list displays 15 objects with the highest number of alarms. The value in the Alarms column shows the number of errors and warnings for an object. For example, 3/1 means that there are 3 error alarms and 1 warning alarm for the object. Click a link in the Source column to drill-down to the list of alarms triggered for a specific virtual infrastructure object.
For details on working with alarms, see Veeam ONE Working with Alarms Guide.