 This is an archive version of the document. To get the most up-to-date information, see the current version.
Provider vDCs Overview
The summary dashboard for the Provider VDCs node provides the health state overview for provider virtual datacenters under a vCloud Director cell.
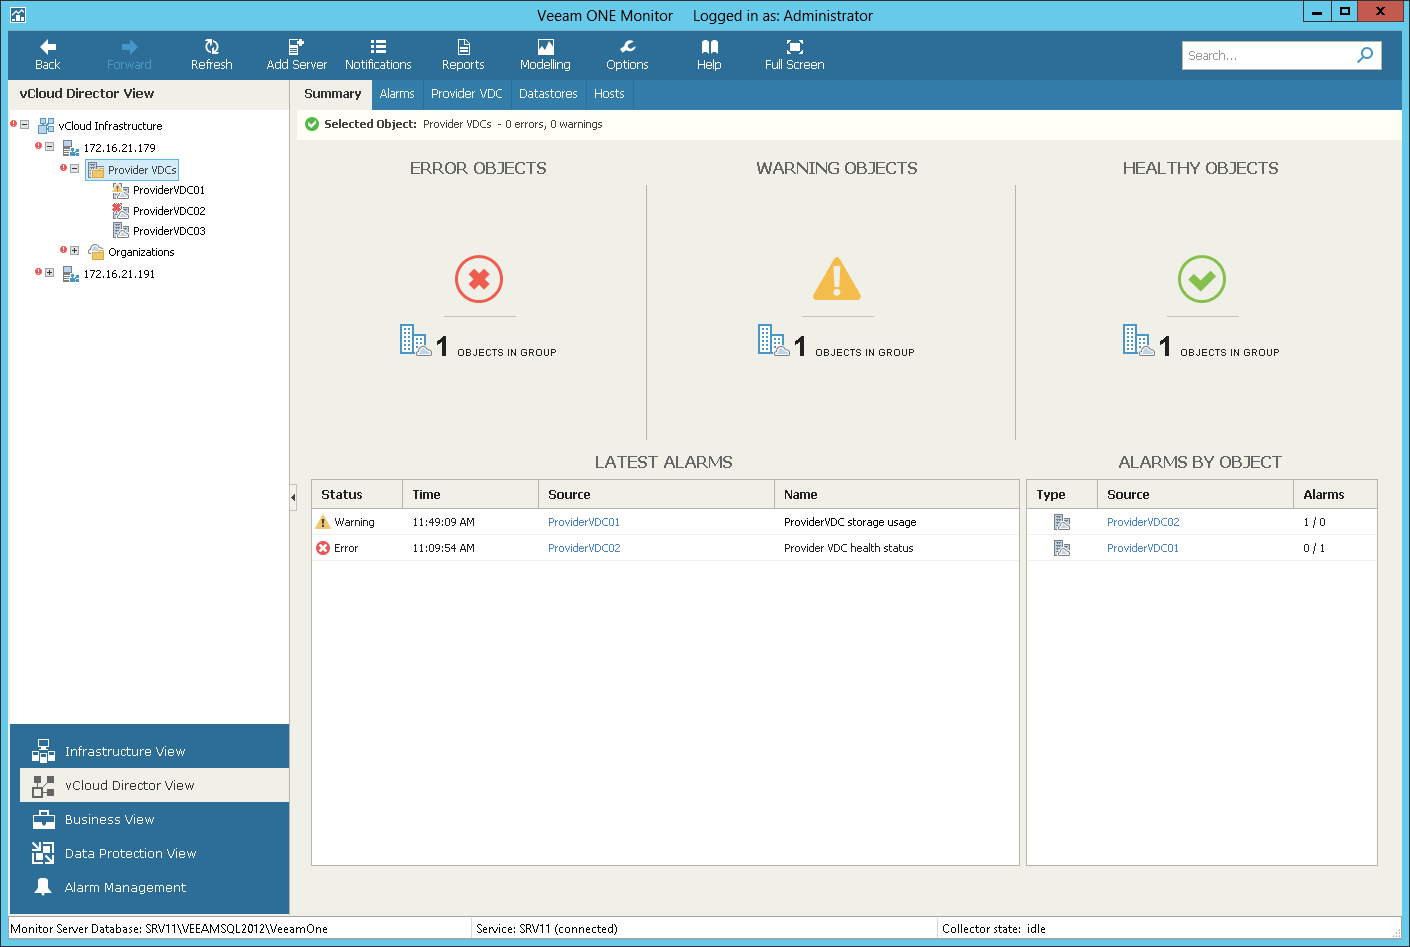
Error Objects, Warning Objects, Healthy Objects
The charts group provider vDCs by their health state. Every chart reflects the number of provider vDCs with a specific state — provider vDCs with errors (red), provider vDCs with warnings (yellow) and healthy provider vDCs (green). Click the problematic chart to drill-down to the list of alarms for vDCs with the chosen health state.
Latest Alarms
The list displays the latest 15 alarms that were triggered for provider vDCs and underlying virtual infrastructure objects (datastores and hosts). Click a link in the Source column to drill-down to the list of alarms triggered for a specific object.
Alarms by Object
The list displays 15 objects with the greatest number of alarms. The value in the Alarms column shows the number of errors and warnings for an object. For example, 3/1 means that there are 3 error alarms and 1 warning alarm for the object. Click a link in the Source column to drill-down to the list of alarms triggered for a specific object.
For details on working with alarms, see Veeam ONE Working with Alarms Guide.