Usage Example
Now, you can create your own sample pivot table for vSphere hosts in the environment to show all average performance metric values that have been recorded to the OpsMgr Data Warehouse during the previous 7 days:
- In the PowerPivot for Excel window, switch to the Home tab and select PivotTable > PivotTable.
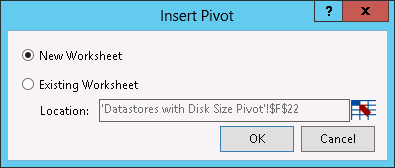
- In the Insert Pivot window, select New Worksheet. This will open a new worksheet in Excel.
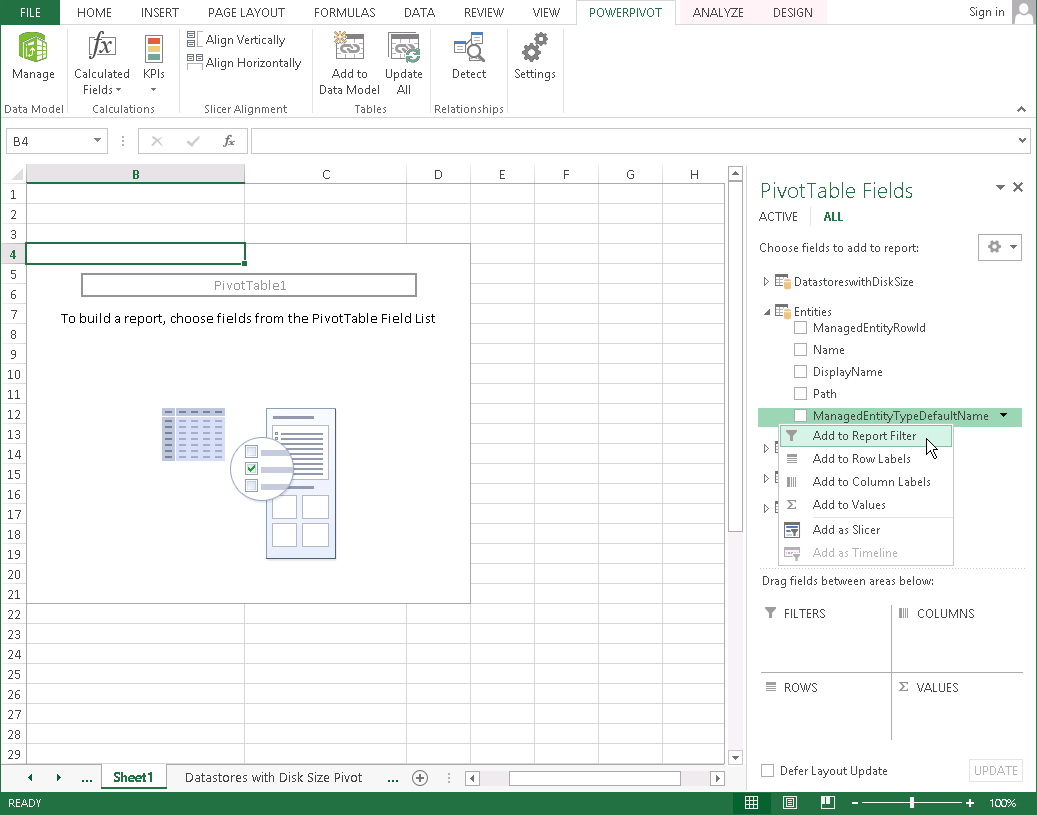
- In PivotTable Fields, expand the Entities drop-down list, right-click ManagedEntityTypeDefaultName and select Add to Report Filter. This will add a new filter for monitored objects in the worksheet.
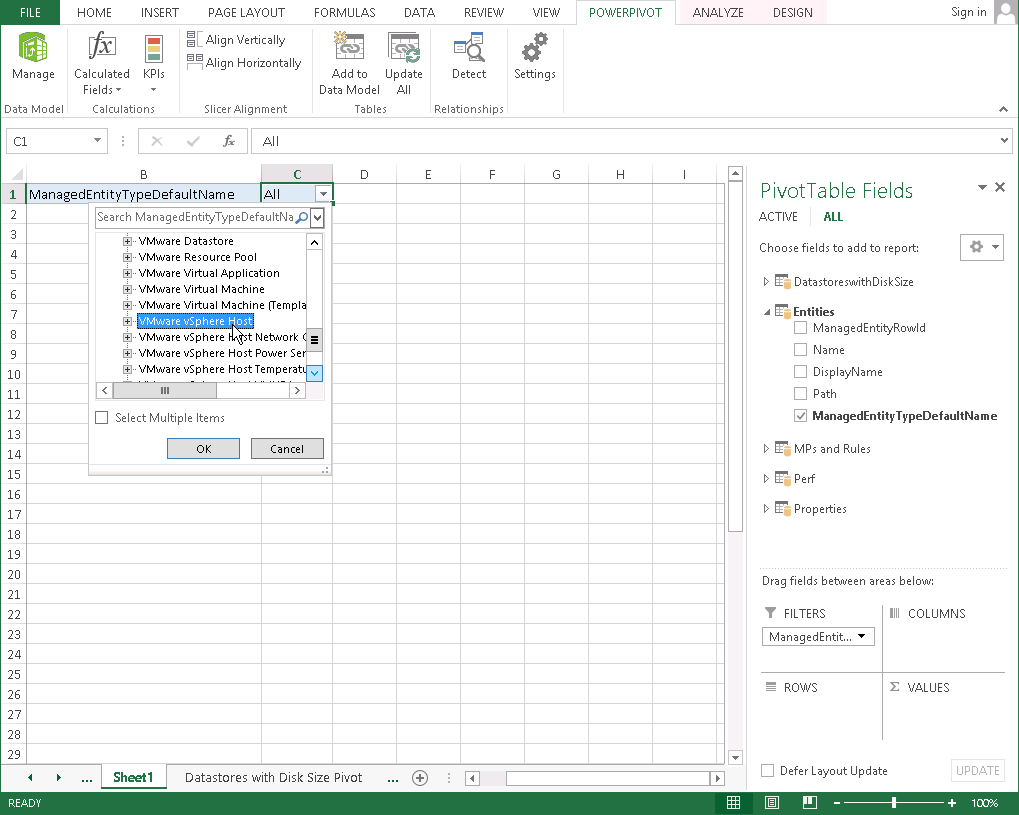
- Expand the drop-down list in the cell with the All value and select VMware vSphere Host. This will narrow the filter results to the objects of the VMware vSphere Host class.
- In PivotTable Fields, expand the Perf drop-down list, right-click CounterName and select Add to Column Labels. This will add new columns with performance metric names in the worksheet.
Similarly, right-click AverageValue, and select Add to Values. This will display metric values for each column in the worksheet.
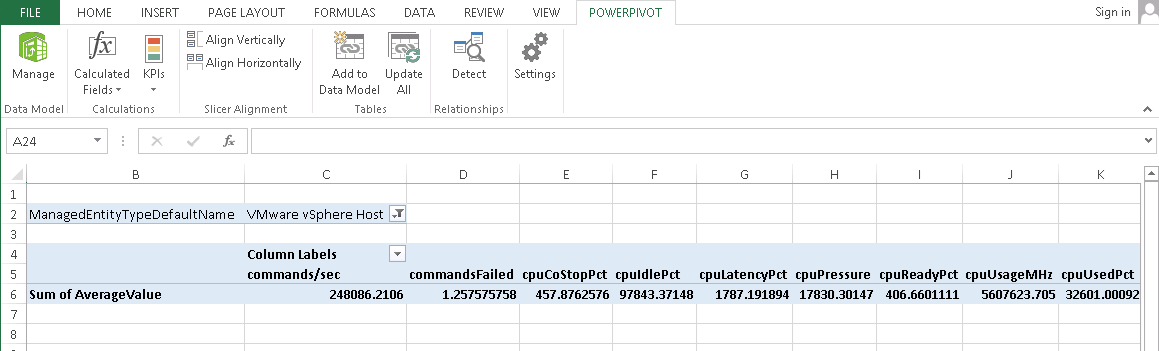
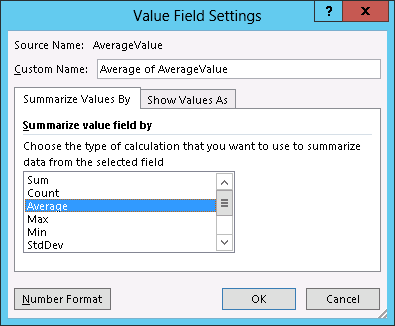
- In the VALUES field, expand the Sum of AverageValue drop-down list and select Value Field Settings.
In the Value Field Settings window, select Average from the Summarize value field by list.
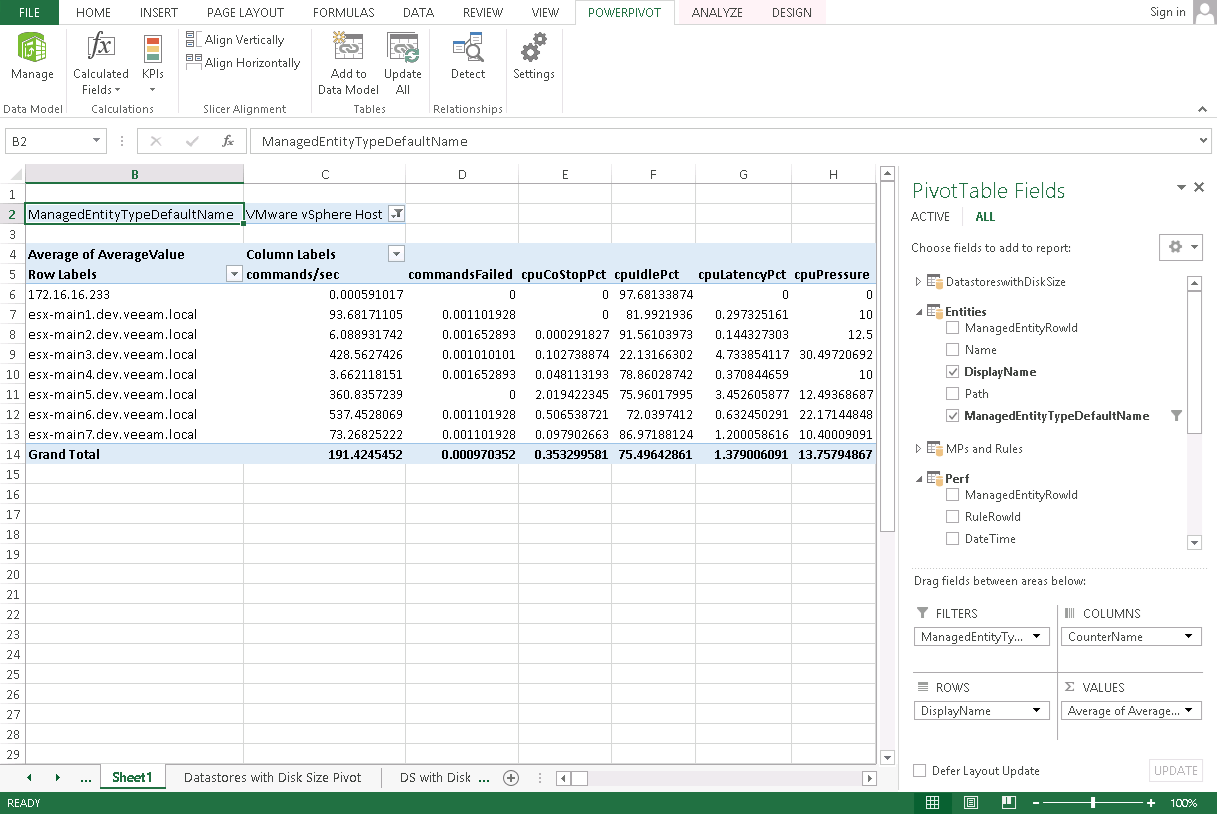
- In PivotTable Fields, expand the Entities drop-down list, right-click DisplayName and select Add to Row Labels. This will display a list of hosts in the worksheet.
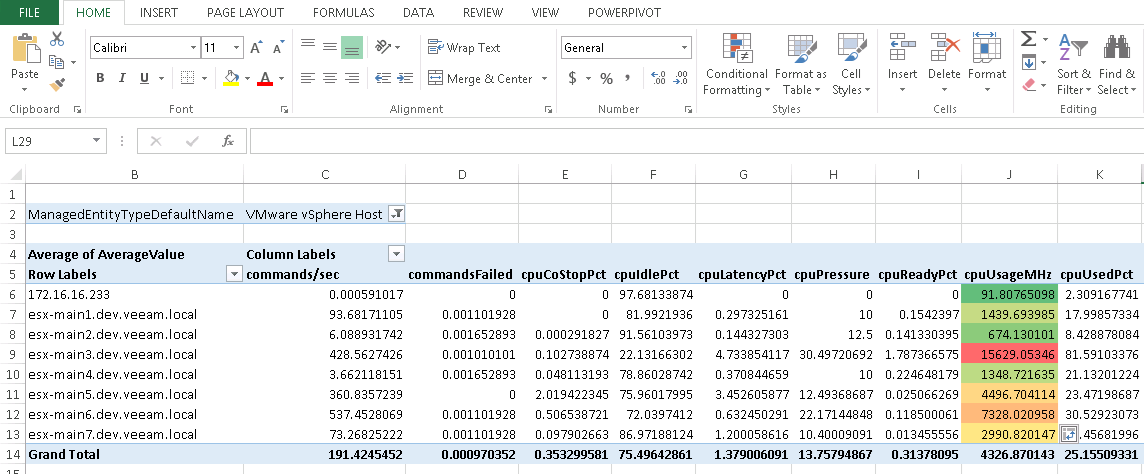
You can use conditional formatting and highlight hosts with the highest CPU usage level:
- Select values in the cpuUsageMHz column.
- On the Home tab, click Conditional Formatting > Color Scales > Red – Yellow- Green Color Scale.
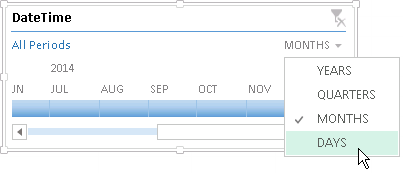
You can also add a timeline to narrow the time frame for data analysis:
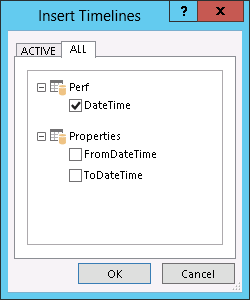
- Open the Pivot Tools Analyze tab and click Insert Timeline.
- In the Insert Timeline window, select Perf.DateTime and click OK.
In the DateTime window, adjust timeline to show DAYS. Then stretch the timeline to include the exact dates for which you want the data to be analyzed.