Veeam Data Platform Monitoring
The Veeam Data Platform Monitoring dashboard displays aggregated information about jobs run on your Veeam Backup & Replication servers.
By default, data is shown from all locations and data source hosts for the last 30 days. To filter data, you can specify another time period, location, or data source host.
Note |
If there are no events from a specific data source host, it will not be displayed on the dashboard. |
The dashboard includes the following panels:
Panel | Description |
|---|---|
Success | The total amount of jobs finished with the Success status. |
Warning | The total amount of jobs finished with the Warning status. |
Failed | The total amount of jobs finished with the Failed status. |
Transferred Data | The total amount of data transferred during backup jobs and file backup jobs. |
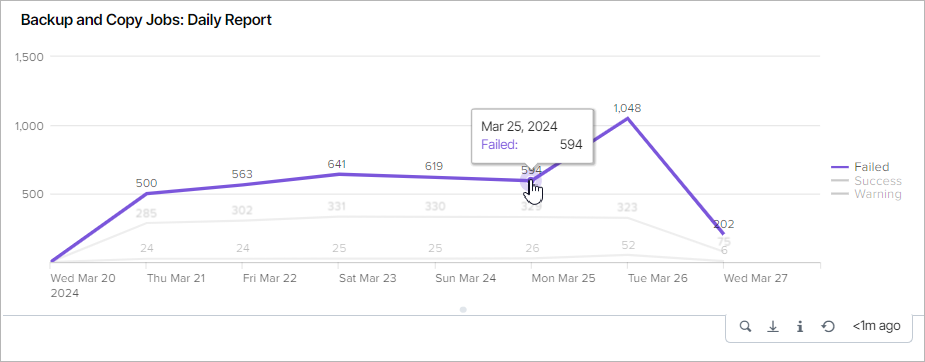
Backup and Copy Jobs: Daily Report | A colored graph displaying daily statistics on finished backup and backup copy jobs. |
SureBackup Jobs: Daily Report | A colored graph displaying daily statistics on finished SureBackup jobs. |
Map | A map chart displaying the state of finished jobs with a breakdown by countries:
Note: If you do not add any locations in the app configuration, the map will not be displayed. For more details, see Managing Locations. |
Finished Jobs by State | A set of pie charts displaying the breakdown of finished jobs by state:
|
Latest Configuration Backups | A table displaying information about the latest configuration backup job run on each Veeam Backup & Replication server. |
Latest Finished Jobs | A table displaying detailed information about the latest finished jobs on each Veeam Backup & Replication server. |
Finished Jobs by Type | A colored stacked bar chart displaying daily statistics on finished jobs by type. |
Finished Restore Sessions by Type | A colored stacked bar chart displaying daily statistics on finished restore sessions by type. |
Unsuccessful VM Backups | A colored stacked bar chart displaying statistics on VM backup jobs finished with the Failed and Warning states on each Veeam Backup & Replication server. |
Unsuccessful Unstructured Data Backups | A colored stacked bar chart displaying statistics on file backup and object storage backup jobs finished with the Failed and Warning states on each Veeam Backup & Replication server. |
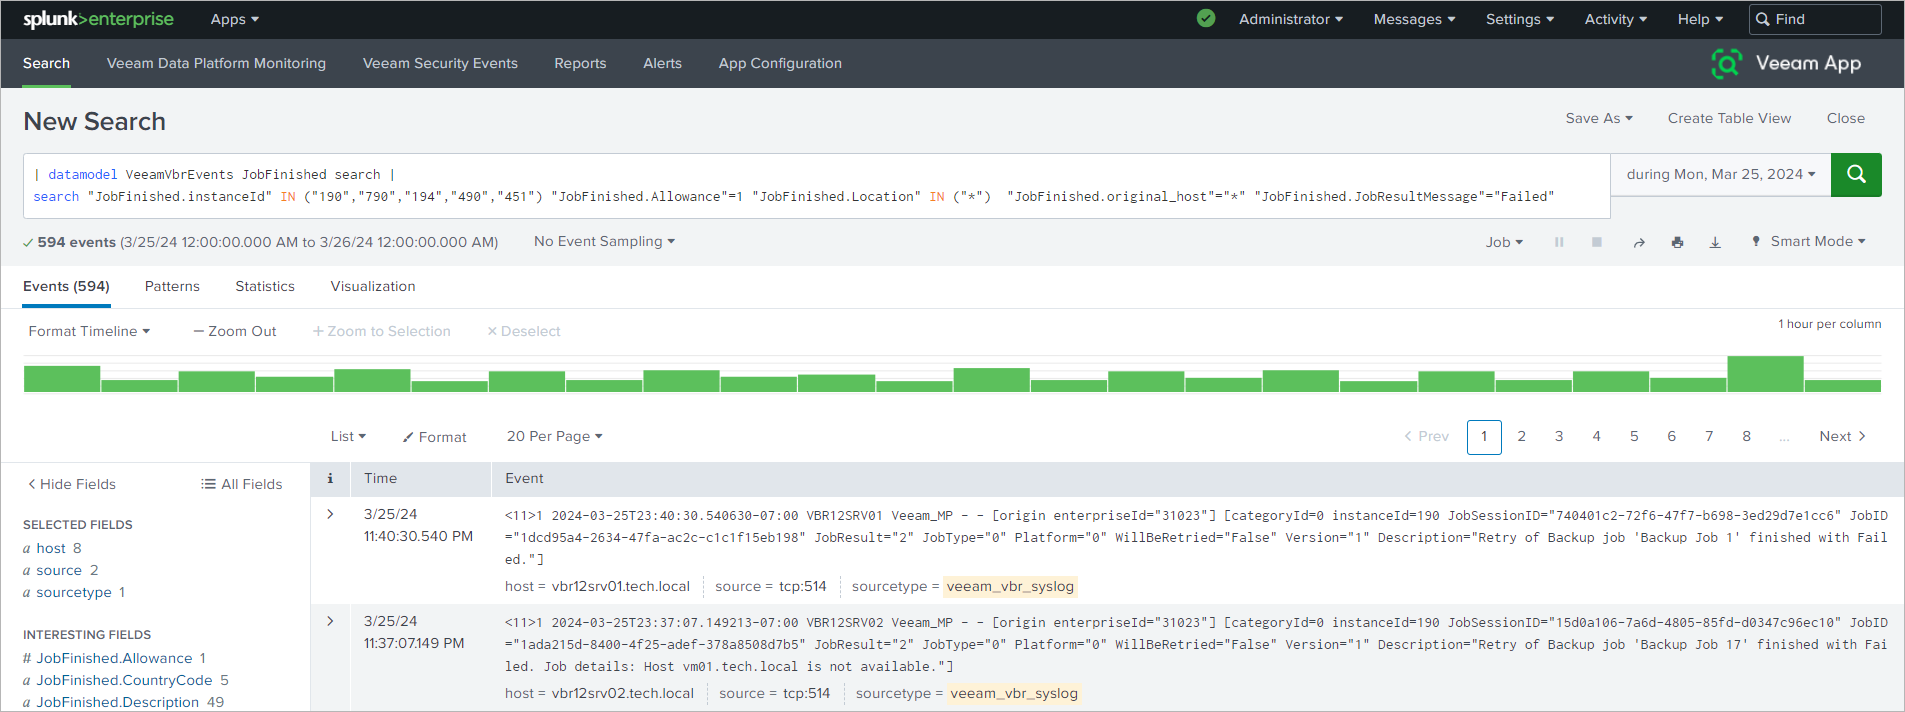
To view detailed information on specific data, hover the mouse over a value on the dashboard and click on it.

A new window with the search query will be opened.

