Veeam Security Activities
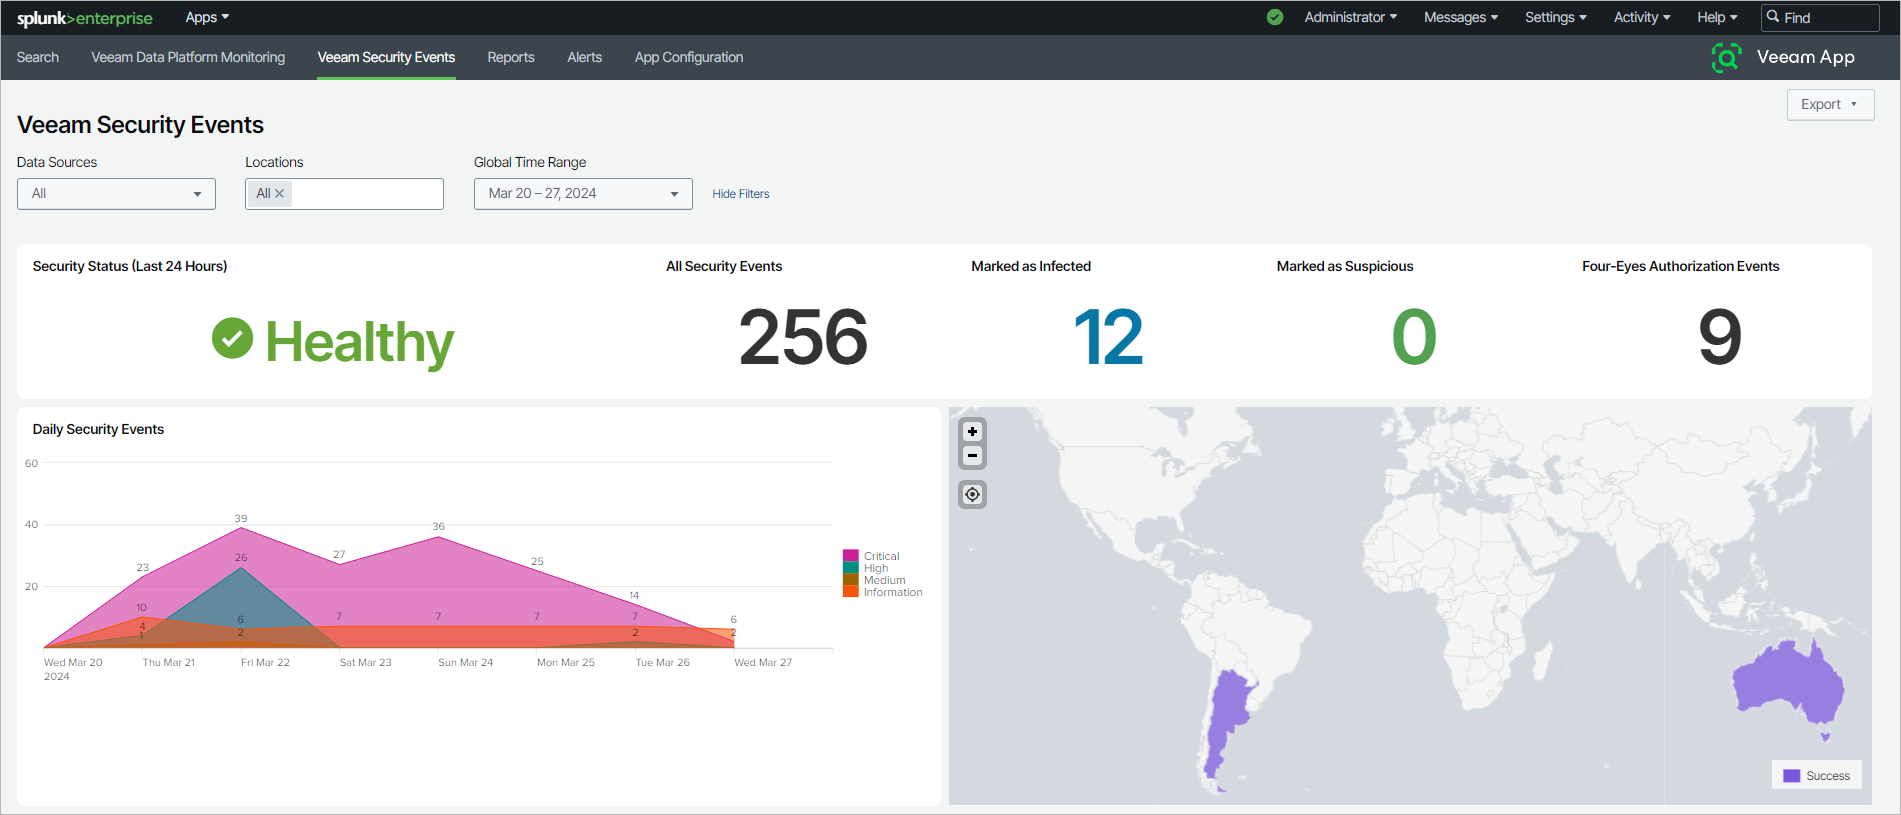
The Veeam Security Activities dashboard displays aggregated information about security activities on your Veeam Backup & Replication and Veeam ONE servers.
By default, data is shown from all locations and data source hosts for the last 30 days. To filter data, you can specify another time period, location, or data source host. The Security Status panel and the map chart always display data for the last 24 hours.
Note |
If there are no activities on a specific data source host, it will not be displayed on the dashboard. |
The dashboard includes the following panels:
Panel | Description |
|---|---|
Veeam Backup & Replication Security Events | A pie chart displaying the breakdown of Veeam Backup & Replication security events by severity level. |
Veeam Backup & Replication Security Events by Name | A pie chart displaying the breakdown of Veeam Backup & Replication security events by name. |
Veeam ONE Alarms | A colored graph displaying the breakdown on Veeam ONE alarms by severity level. |
Veeam ONE Alarms by Name | A pie chart displaying the breakdown of Veeam ONE alarms by name. |
Security Status (Last 24 Hours) | Current infrastructure security status depending on the severity level of security activities:
Dashboard filters do not affect this indicator. |
All Security Activities | The total amount of security activities including Veeam Backup & Replication security events and Veeam ONE alarms. |
Marked as Infected | The total amount of objects marked as Infected. For more information, see Malware Detection in the Veeam Backup & Replication User Guide. |
Marked as Suspicious | The total amount of objects marked as Suspicious. For more information, see Malware Detection in the Veeam Backup & Replication User Guide. |
Four-Eyes Authorization Events | The total amount of four-eyes authorization events. For more information, see Four-Eyes Authorization in the Veeam Backup & Replication User Guide. |
Map | A map chart displaying infrastructure security status for the last 24 hours with a breakdown by countries. Dashboard filters do not affect this indicator. Note: If you do not add any locations in the app configuration, the map will not be displayed. For more details, see Managing Locations. |
Daily Veeam Backup & Replication Security Events | A colored graph displaying daily statistics on Veeam Backup & Replication security events by severity level. |
Daily Veeam ONE Alarms | A colored graph displaying daily statistics on Veeam ONE alarms by severity level. |
Latest Veeam Backup & Replication Security Events | A table displaying information about the latest security events triggered on each Veeam Backup & Replication server. |
Latest Veeam ONE Alarms | A table displaying information about the latest alarms triggered on each Veeam Veeam ONE server. |
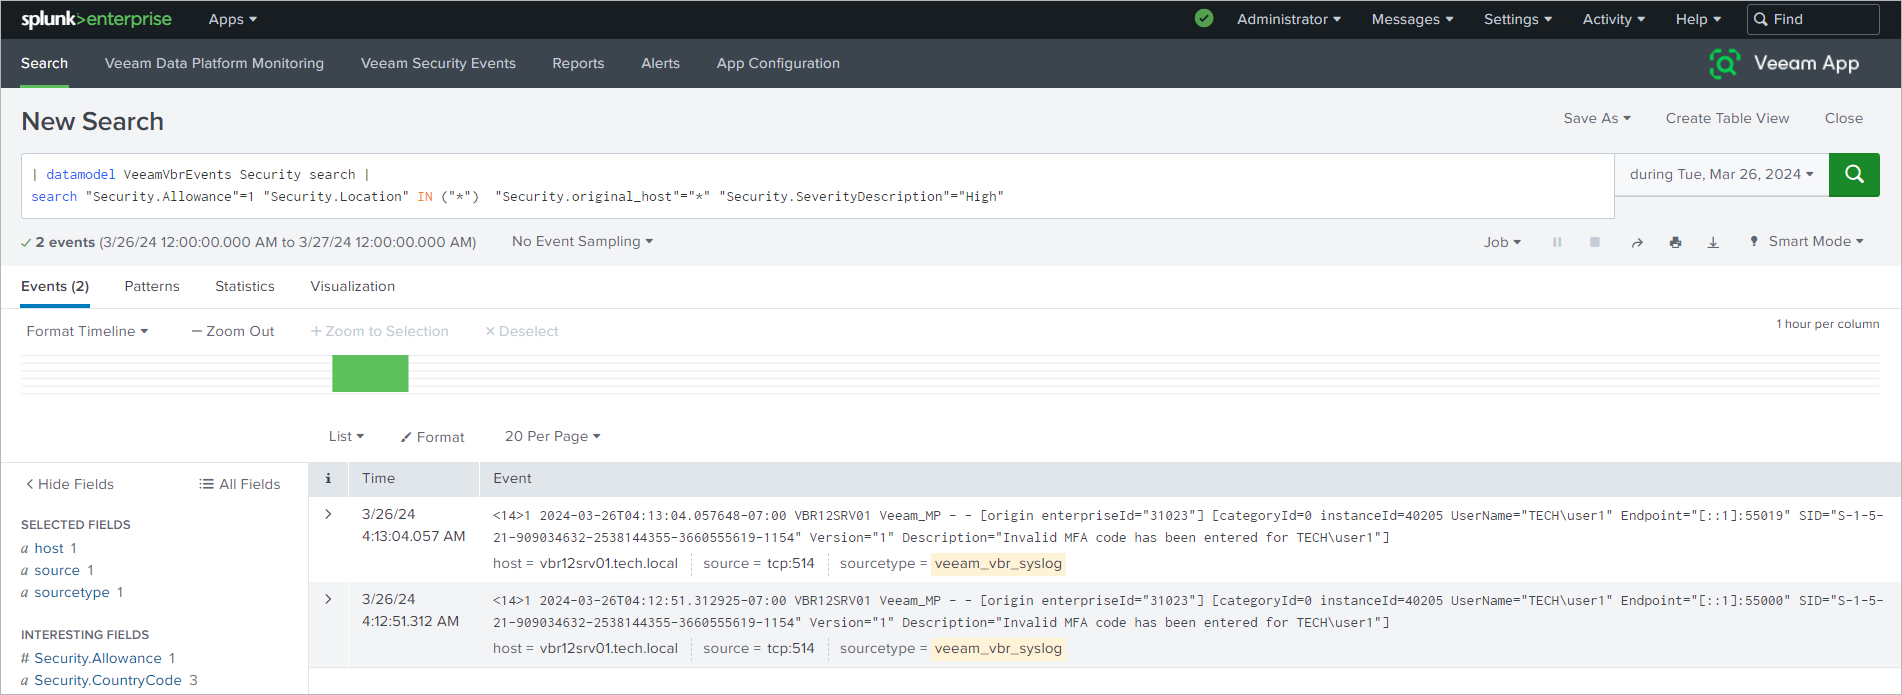
To view detailed information on specific data, hover the mouse over a value on the dashboard and click on it.
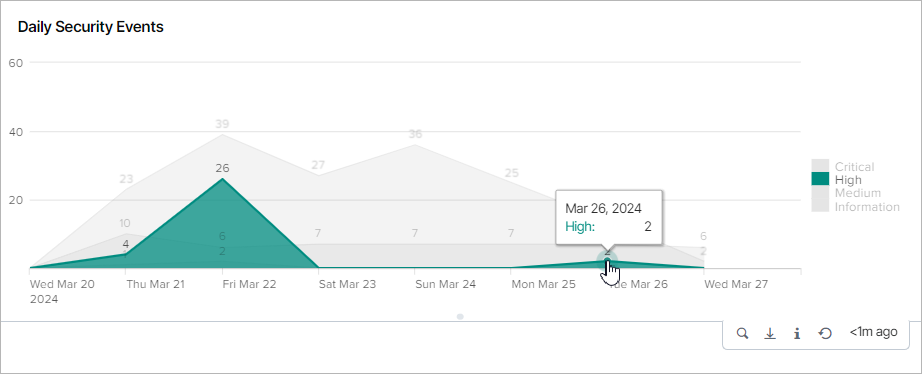
A new window with the search query will be opened.