This is an archive version of the document. To get the most up-to-date information, see the current version.
VMware vSphere Top and Lowest Load
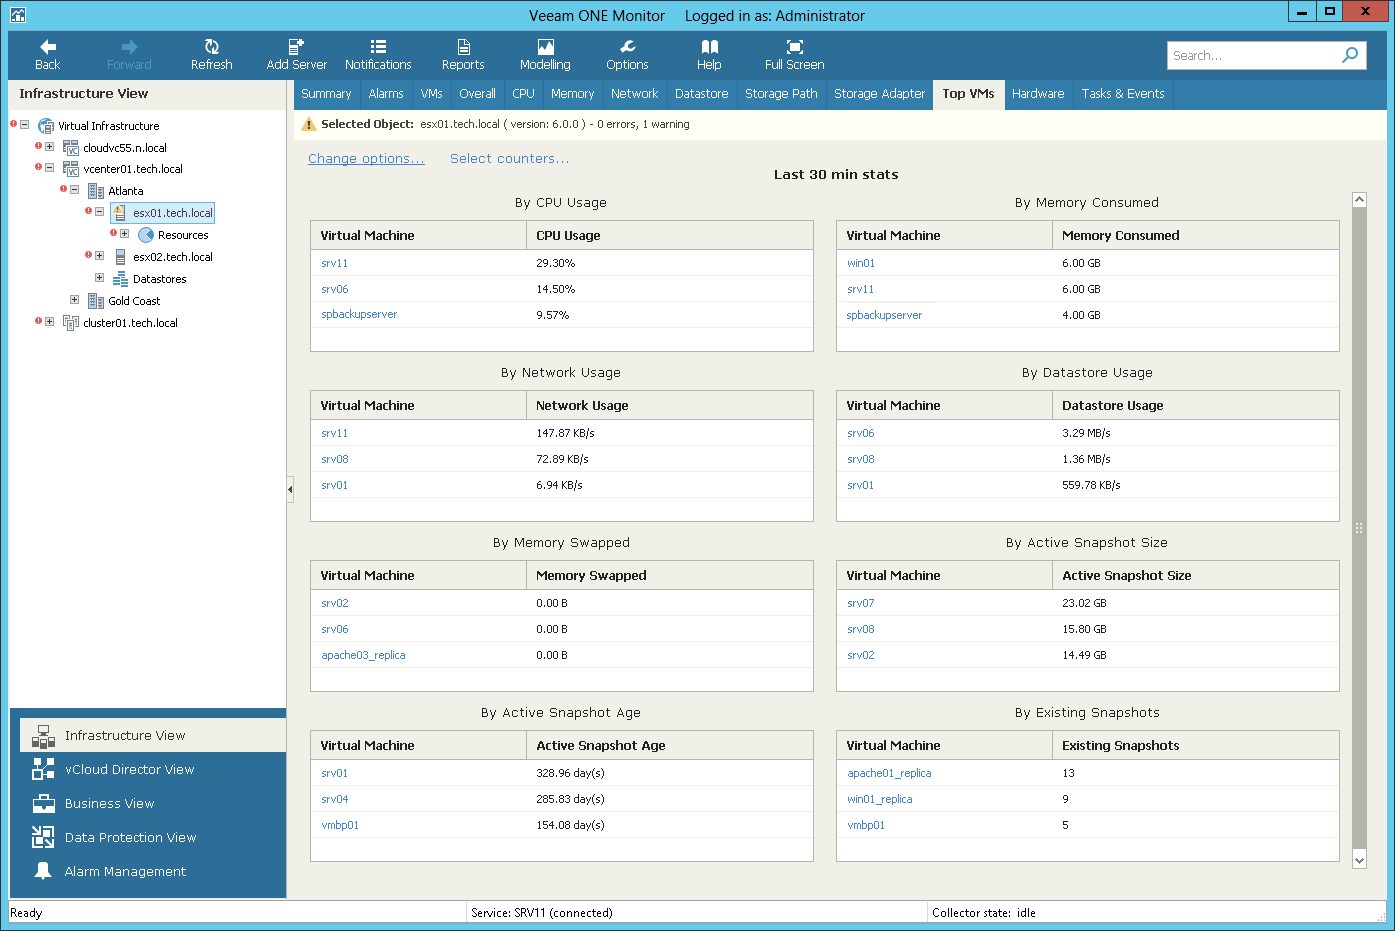
The top and lowest load dashboards help you detect VMs and hosts consuming the most and the least amount of resources in the selected virtual infrastructure segment:
- Top VMs dashboard displays top VM consumers in terms of CPU, memory, datastore, network usage, memory swapped, active snapshot size, active snapshot age and the number of existing snapshots.
- Top Hosts dashboard displays top host consumers in terms of CPU, memory, datastore, network usage and swapped memory.
- Lowest Load dashboard displays least loaded hosts in terms of CPU, memory, datastore, network and memory swap used.
You can use this dashboard to choose hosts where you can deploy new VMs or to which you can move existing VMs.
To detect the most and the least loaded hosts or VMs:
- Open Veeam ONE Monitor.
For details, see Accessing Veeam ONE Monitor.
- At the bottom of the inventory pane, click Infrastructure View.
- In the inventory pane, select the necessary infrastructure container.
- Switch to the necessary dashboard — Top VMs, Top Hosts or Lowest Load.
- At the top left corner of the dashboard, click the Change options link.
- In the Interval field, set the time interval for which resource utilization statistics must be analyzed.
- In the VMs to display/Hosts to display field, specify the number of objects to display on the dashboard.
- At the top left corner of the dashboard, click the Select counters link.
- In the Select counters window, choose metrics that must be included in the dashboard.
Press and hold the [SHIFT] or [CTRL] key on the keyboard to select multiple counters.
- Click OK.