
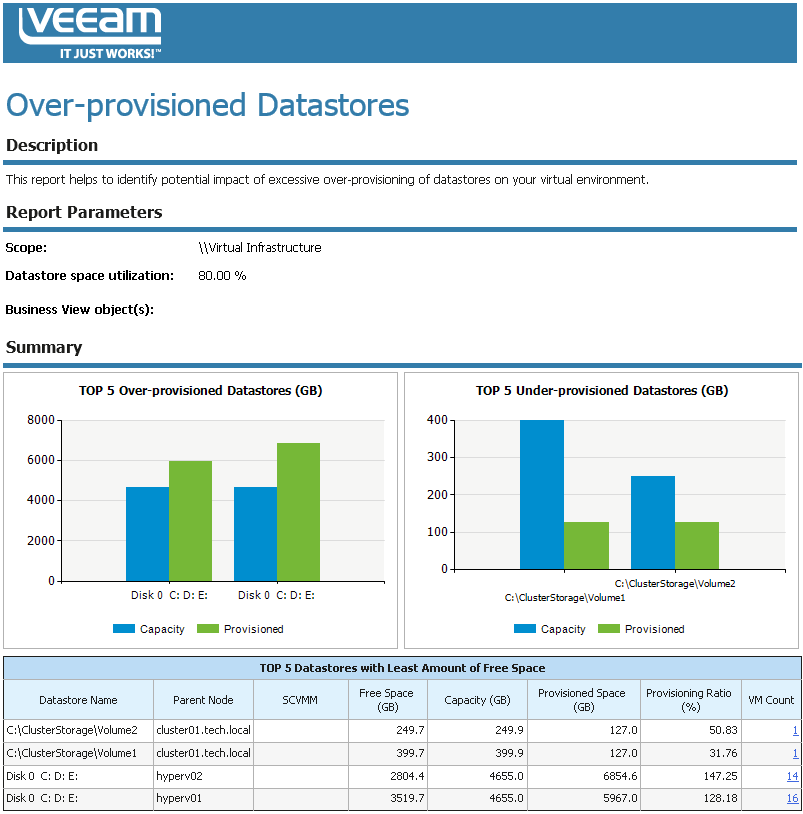
Dynamic disk technology allows administrators to dedicate more storage space to VMs than there is real physical capacity. This report helps you assess the potential impact of excessive over-provisioning of disks on your virtual environment.
- TOP 5 Over-provisioned Datastores chart shows 5 disks whose amount of provisioned storage space exceeds the total capacity.
- TOP 5 Under-provisioned Datastores chart shows 5 disks whose amount of provisioned storage space is way below the total capacity.
- TOP 5 Datastores with Least Amount of Free Space table displays top 5 disks that will run out of free space sooner than other disks.
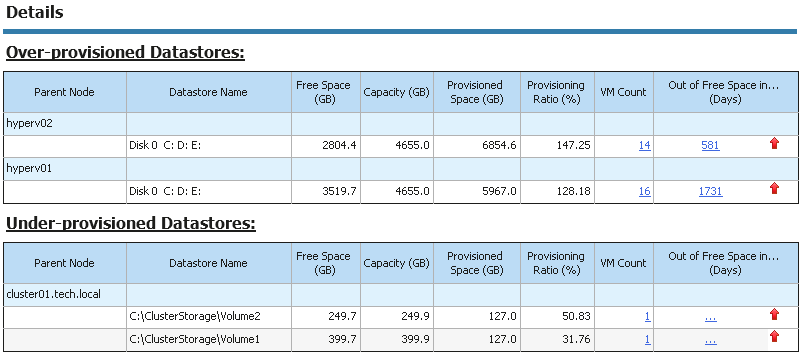
For each disk included in the report, the Details tables provide information on storage space utilization and the number of days left before the specified space utilization/free space threshold will be breached. Arrows in the Out of Free Space in … (Days) column show whether the amount of free space on the disk has increased (green arrow), decreased (red arrow) or stayed the same (blue arrow) over the previous week.
|
|
Use Case
The report analyzes disk space utilization trend and calculates the number of days left before storage utilization will breach the specified threshold.
Report Parameters
Scope: defines a virtual infrastructure level and its sub-components to analyze in the report.
Business View object(s): defines Business View groups to analyze in the report. The parameter options are limited to objects of the “Storage” type.
Datastore space utilization (%): defines the threshold for the amount of space in use on the disks.
Datastore free space (GB): defines the threshold for the amount of free space left on the disks.
