
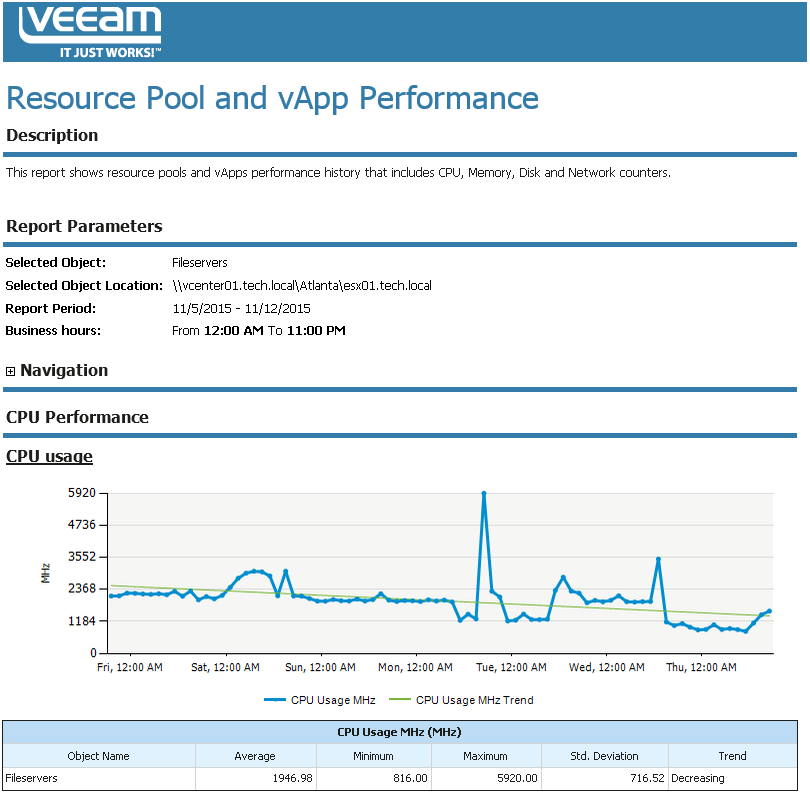
This report aggregates historical data and shows performance statistics for a selected resource pool/vApp across a time range.
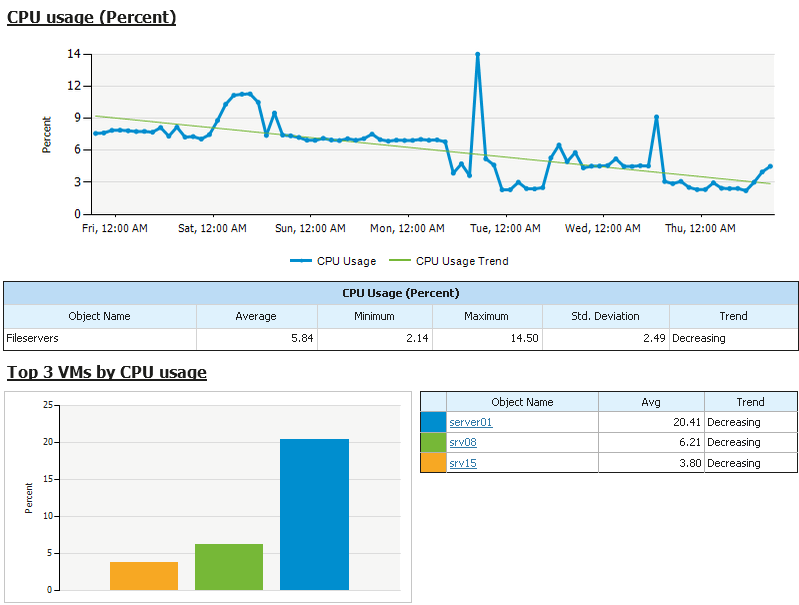
The report shows tables and performance charts with statistics on CPU, memory, disk and network usage for the resource pool/vApp. The report also lists top resource consuming VMs and calculates resource usage trends for them.
|
|
Use Case
The report helps you identify resource pools and vApps with performance issues, evaluate how efficiently your resource pools and vApps are performing, and decide whether additional right-sizing or reconfiguration actions are necessary.
Report Parameters
Object: defines the resource pool or vApp to analyze in the report.
Interval/Start Date - End Date: defines the time period to analyze in the report. Note that the reporting period must include at least one data collection session for the selected resource pool/vApp. Otherwise, the report will contain no data.
Top N: defines the maximum number of VMs to display in the report output.
Business hours from - to: defines time of a day for which historical performance data will be used to calculate the performance trend. All data beyond this interval will be excluded from the baseline used for data analysis.
