This is an archive version of the document. To get the most up-to-date information, see the current version.
Network Performance Chart
In this article
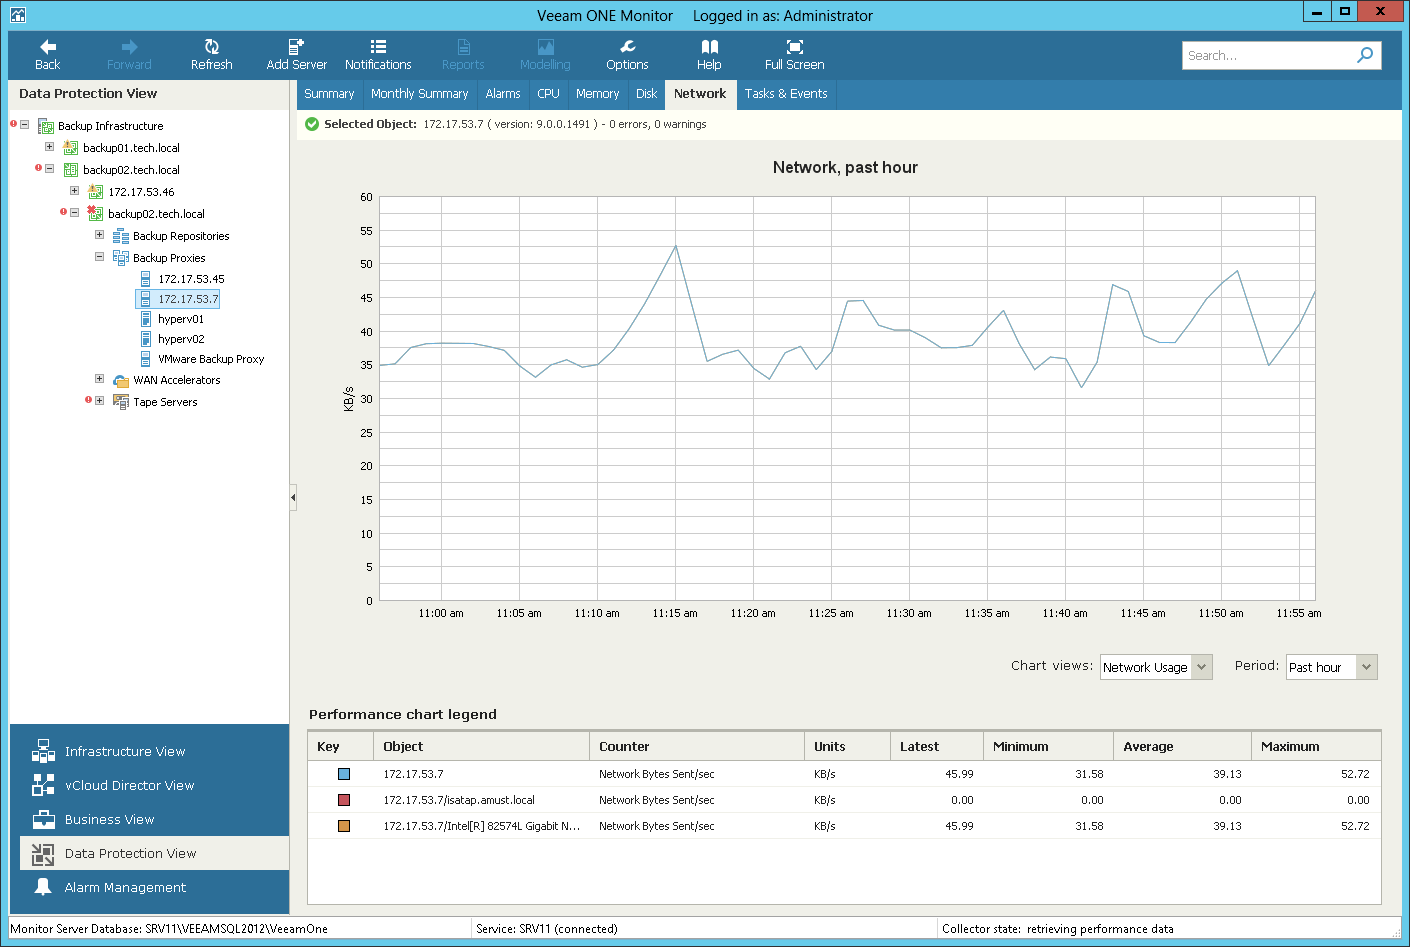
The Network chart shows the throughput for NICs on a machine where a backup infrastructure component runs. Graphs in the Network chart illustrate the rate at which data is sent on the network interface for each separate NIC. A separate graph shows the cumulative rate for all NICs on the machine.