Veeam Security Activities
The Veeam Security Activities dashboard displays aggregated information on security activities on your Veeam Backup & Replication and Veeam ONE servers. The data is collected both through syslog servers and Veeam REST APIs.
By default, data is shown from all data source hosts. To filter data, you can select specific time period or data source host.
|
Note |
|
Consider the following:
|
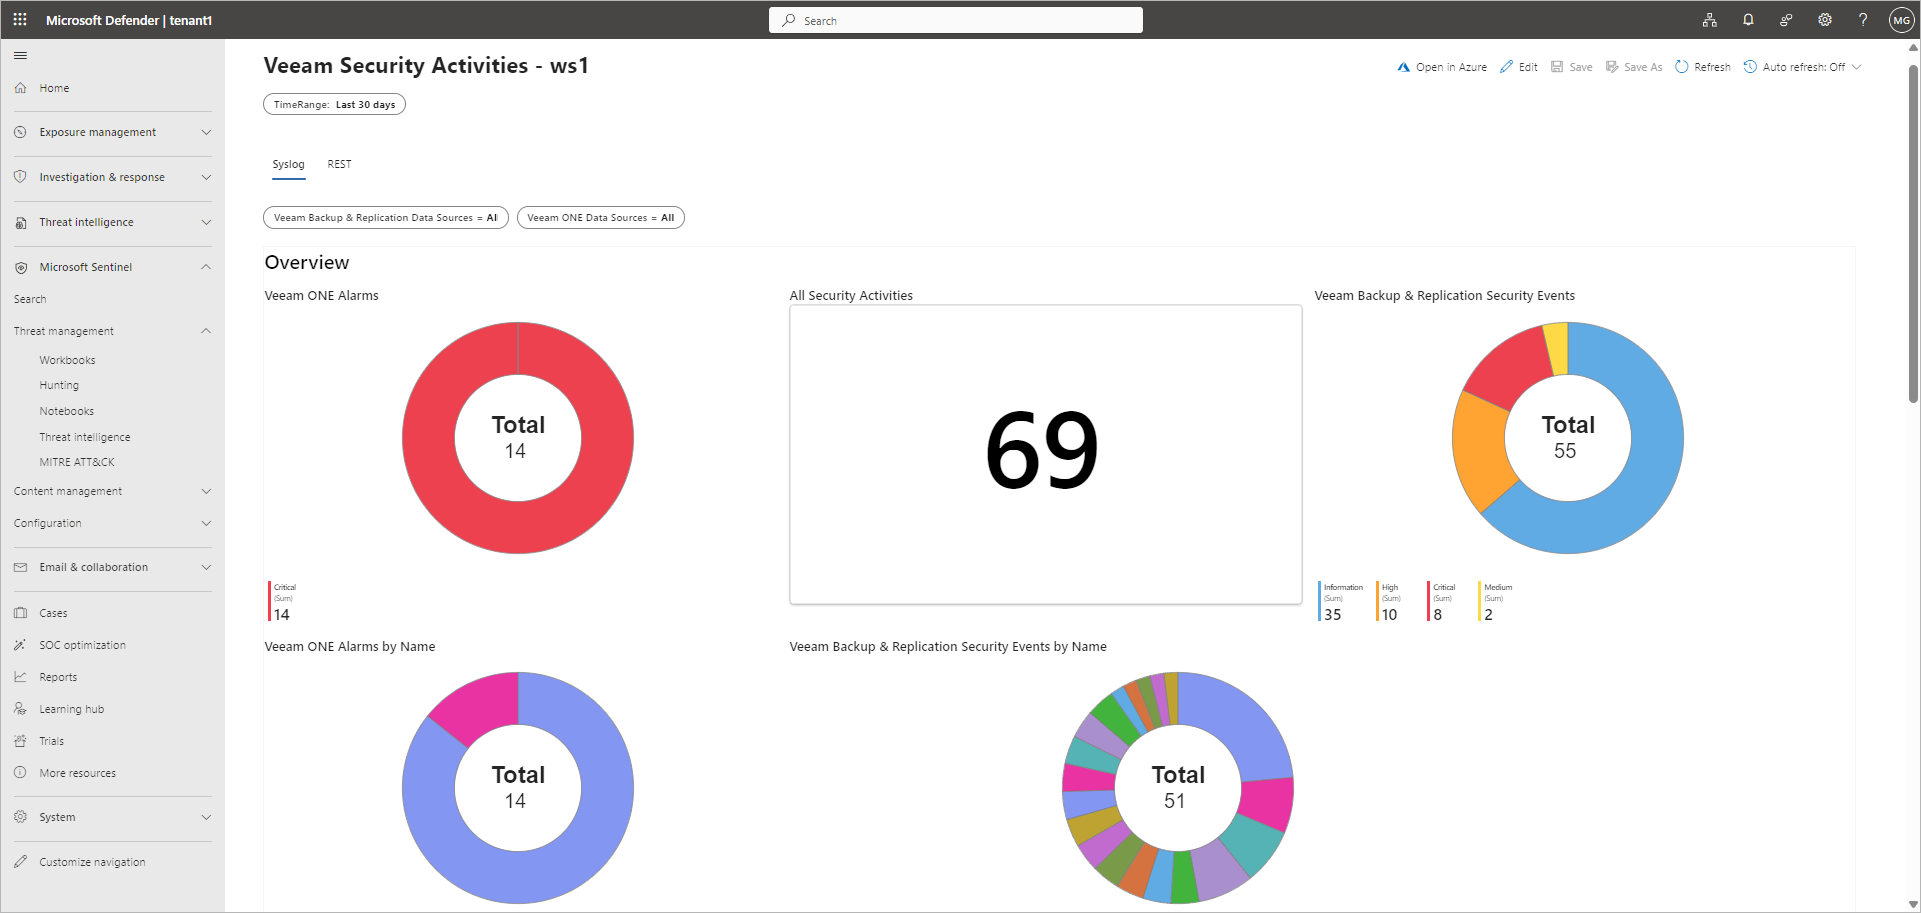
Activities Collected from Syslog Servers
The Syslog tab includes the following widgets:
|
Widget |
Description |
|---|---|
|
Overview |
|
|
All Security Activities |
The total amount of security activities including Veeam Backup & Replication security events and Veeam ONE alarms. By default, the widget displays data for the last 7 days. |
|
Veeam Backup & Replication Security Events |
A pie chart displaying the breakdown of Veeam Backup & Replication security events by severity level. By default, the widget displays data for the last 24 hours. |
|
Veeam ONE Alarms |
A colored graph displaying the breakdown of Veeam ONE alarms by severity level. By default, the widget displays data for the last 24 hours. |
|
Veeam Backup & Replication Security Events by Name |
A pie chart displaying the breakdown of Veeam Backup & Replication security events by name. By default, the widget displays data for the last 30 days. |
|
Veeam ONE Alarms by Name |
A pie chart displaying the breakdown of Veeam ONE alarms by name. By default, the widget displays data for the last 30 days. |
|
Marked as Infected |
The total amount of objects marked as Infected. For more information, see Malware Detection in the Veeam Backup & Replication User Guide. By default, the widget displays data for the last 24 hours. |
|
Marked as Suspicious |
The total amount of objects marked as Suspicious. For more information, see Malware Detection in the Veeam Backup & Replication User Guide. By default, the widget displays data for the last 24 hours. |
|
Four-Eyes Authorization Events |
The total amount of four-eyes authorization events. For more information, see Four-Eyes Authorization in the Veeam Backup & Replication User Guide. By default, the widget displays data for the last 24 hours. |
|
Daily Security Activities |
|
|
Daily Veeam Backup & Replication Security Events |
A colored graph displaying daily statistics on Veeam Backup & Replication security events by severity level. By default, the widget displays data for the last 30 days. |
|
Daily Veeam ONE Alarms |
A colored graph displaying daily statistics on Veeam ONE alarms by severity level. By default, the widget displays data for the last 30 days. |
|
Latest Security Activities |
|
|
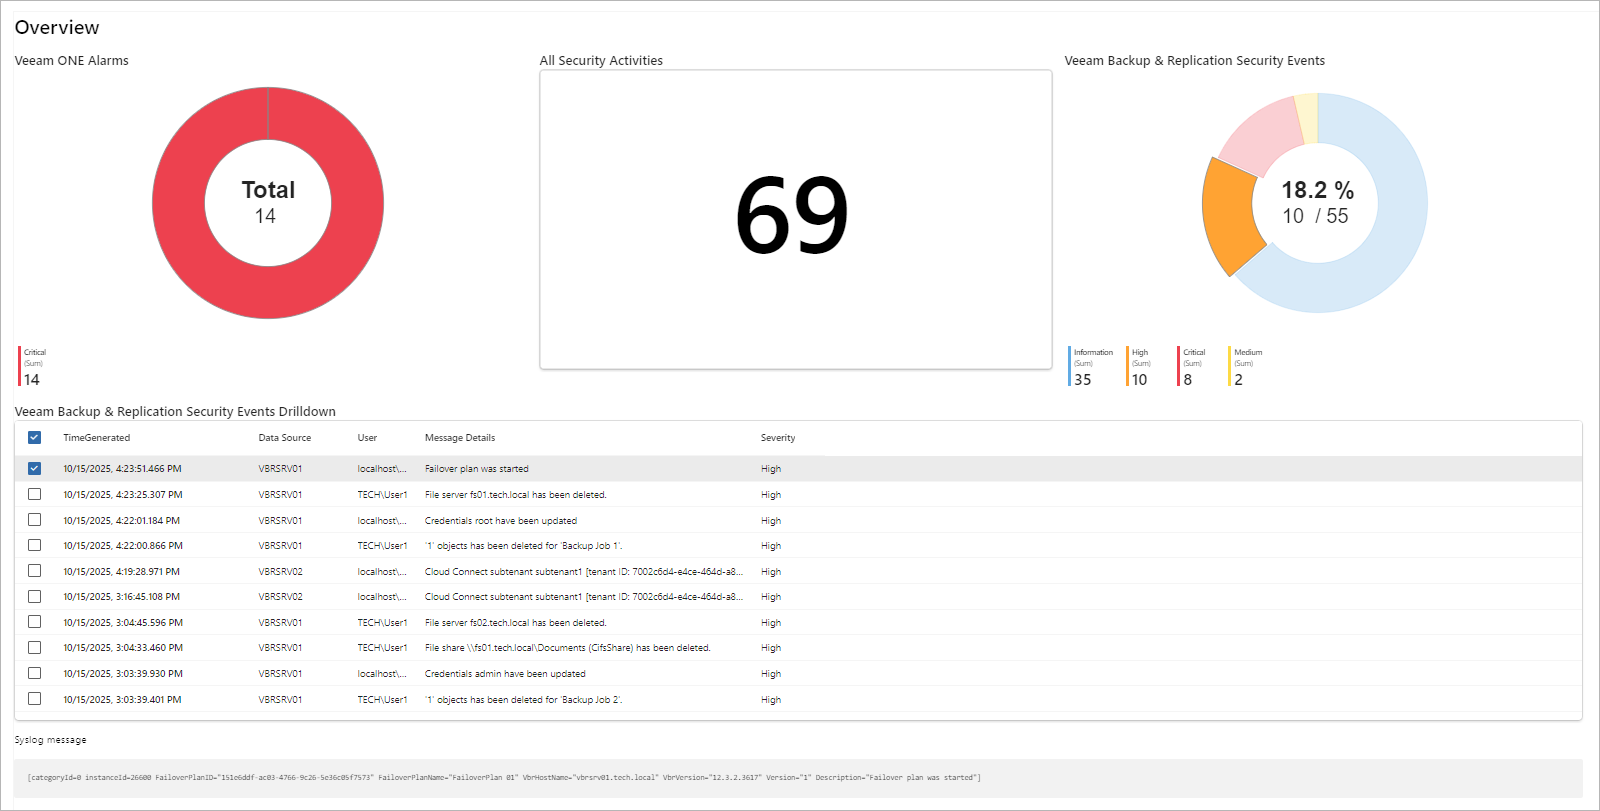
Latest Veeam Backup & Replication Security Events |
A table displaying information on the latest security events triggered on each Veeam Backup & Replication server. By default, the widget displays data for the last 30 days. |
|
Latest Veeam ONE Alarms |
A table displaying information on the latest alarms triggered on each Veeam ONE server. By default, the widget displays data for the last 30 days. |
|
Four-Eyes Authorization Events |
|
|
Four-Eyes Authorization Events by Operation |
A colored stacked bar chart displaying daily statistics on four-eyes authorization events by operation. By default, the widget displays data for the last 7 days. |
To view drilldown information on specific data, click on the widget value. For a selected event or alarm, a detailed syslog message is also displayed.
|
Tip |
|
To switch to another value, click on the selected widget value to clear the data. Then, select the desired value on the same or another widget. |
Activities Collected from REST APIs
The REST tab includes the following widgets:
|
Widget |
Description |
|---|---|
|
Custom Tables Events Overview |
|
|
Veeam ONE Triggered Alarms by Status |
A pie chart displaying the breakdown of Veeam ONE triggered alarms by status. By default, the widget displays data for the last 30 days. |
|
Veeam ONE Triggered Alarms by Name |
A pie chart displaying the breakdown of Veeam ONE triggered alarms by name. By default, the widget displays data for the last 30 days. |
|
Malware Events by Severity |
A pie chart displaying the breakdown of malware events by severity level. By default, the widget displays data for the last 30 days. |
|
Authorization Events by State |
A pie chart displaying the breakdown of four-eyes authorization events by state. By default, the widget displays data for the last 30 days. |
|
Security & Compliance Analyzer Results by Status |
A pie chart displaying the breakdown of Security & Compliance Analyzer results by status. By default, the widget displays data for the last 30 days. |
|
Infected Files Detected |
The total amount of objects marked as Infected. For more information, see Malware Detection in the Veeam Backup & Replication User Guide. By default, the widget displays data for the last 24 hours. |
|
All Custom Table Events by Type |
A pie chart displaying the breakdown of all custom table events by type. By default, the widget displays data for the last 30 days. |
|
Daily Trends |
|
|
Coveware Findings by Name |
A pie chart displaying the breakdown of Recon security findings by name. By default, the widget displays data for the last 30 days. |
|
Daily Coveware Findings by Risk Level |
A colored graph displaying daily statistics on Recon security findings by risk level. By default, the widget displays data for the last 7 days. |
|
Coveware Findings Details |
A table displaying detailed information on Recon security findings. By default, the widget displays data for the last 30 days. |
|
Daily Veeam ONE Triggered Alarms |
A colored graph displaying daily statistics on Veeam ONE triggered alarms by status. By default, the widget displays data for the last 7 days. |
|
Daily Malware Events |
A colored graph displaying daily statistics on malware events by severity level. By default, the widget displays data for the last 7 days. |
|
Daily Four-Eyes Authorization Events |
A colored graph displaying daily statistics on four-eyes authorization events by state. By default, the widget displays data for the last 7 days. |
|
Latest Events |
|
|
Latest Veeam ONE Triggered Alarms |
A table displaying information on the latest alarms triggered on each Veeam ONE server. By default, the widget displays data for the last 30 days. |
|
Latest Malware Events |
A table displaying information on the latest malware events created on each Veeam Backup & Replication server. By default, the widget displays data for the last 30 days. |
|
Latest Authorization Events |
A table displaying information on the latest four-eyes authorization events created on each Veeam Backup & Replication server. By default, the widget displays data for the last 30 days. |
|
Latest Security & Compliance Analysis |
A table displaying information on the latest Security & Compliance Analyzer results on each Veeam Backup & Replication server. By default, the widget displays data for the last 30 days. |
To view drilldown information on specific data, click on the widget value.
|
Tip |
|
To switch to another value, click on the selected widget value to clear the data. Then, select the desired value on the same or another widget. |
