 This is an archive version of the document. To get the most up-to-date information, see the current version.
CPU Performance Chart
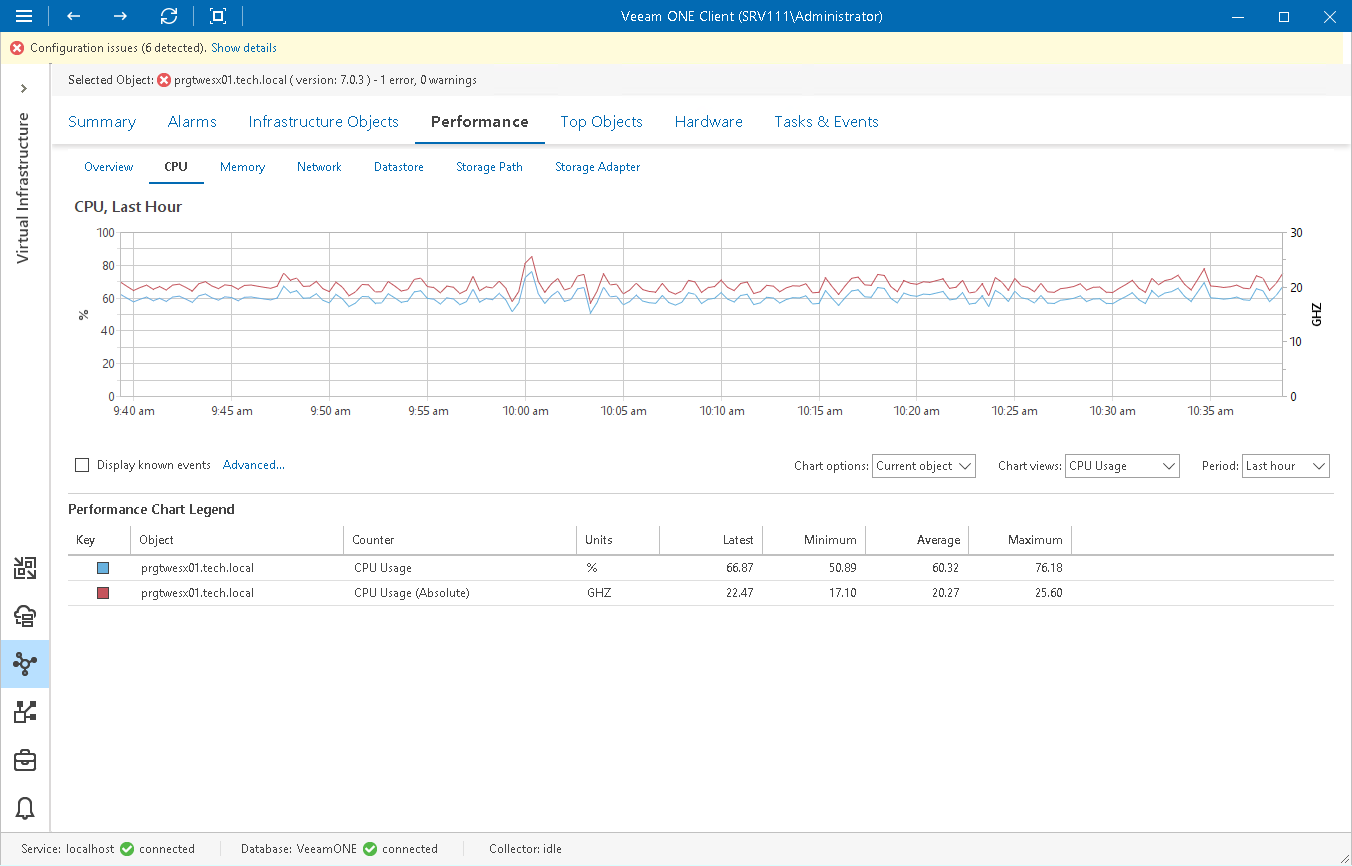
The CPU chart displays historical statistics on CPU utilization for the selected infrastructure object.
Host
The following table provides information on predefined views and counters that apply to hosts.
Chat View | Counter | Measurement Unit | Description |
CPU Usage | CPU Usage | Percent | Actively used CPU of the host, as a percentage of total available CPU. |
CPU Usage MHz | MHz | Sum of actively used CPU of all powered on VMs on the host. | |
CPU Bottlenecks | Average CPU Ready | Percent | Average CPU Ready value for all VMs on the host. |
Virtual Machine
The following table provides information on predefined views and counters that apply to virtual machines.
Chat View | Counter | Measurement Unit | Description |
CPU Usage | CPU Usage | Percent | Amount of actively used virtual CPU resources, as a percentage of total available CPU (this is the host’s view, not the guest OS view). |
CPU usage MHz | MHz | Amount of actively used virtual CPU resources (this is the host’s view, not the guest OS view). | |
CPU Bottlenecks | Average CPU Idle All Cores | Percent | Percent of time all CPU cores spent in an idle state. |
Average CPU Ready All Cores | Percent | Average CPU Ready value across all cores of the virtual machine on the host. | |
Average CPU Standstill All Cores | Percent | Percent of time all CPU cores spent in a standstill state. | |
Average CPU Wait All Cores | Percent | Time spent waiting for hardware or VMKernel lock thread locks. | |
CPU Co-Stop All Cores | Percent | Time the VM was ready to run but was unable due to co-scheduling constraints. |
For objects that are parent to ESX(i) hosts and VMs, Veeam ONE displays rollup values.
Charts for folders, clusters, datacenters, vCenter Servers display rollup values for all hosts in the container. Charts for resource pools display rollup values for all VMs in the resource pool.