 This is an archive version of the document. To get the most up-to-date information, see the current version.
Disk I/O Chart
The Disk I/O chart is available for datastores and datastore clusters; it displays historical statistics on read and write load.
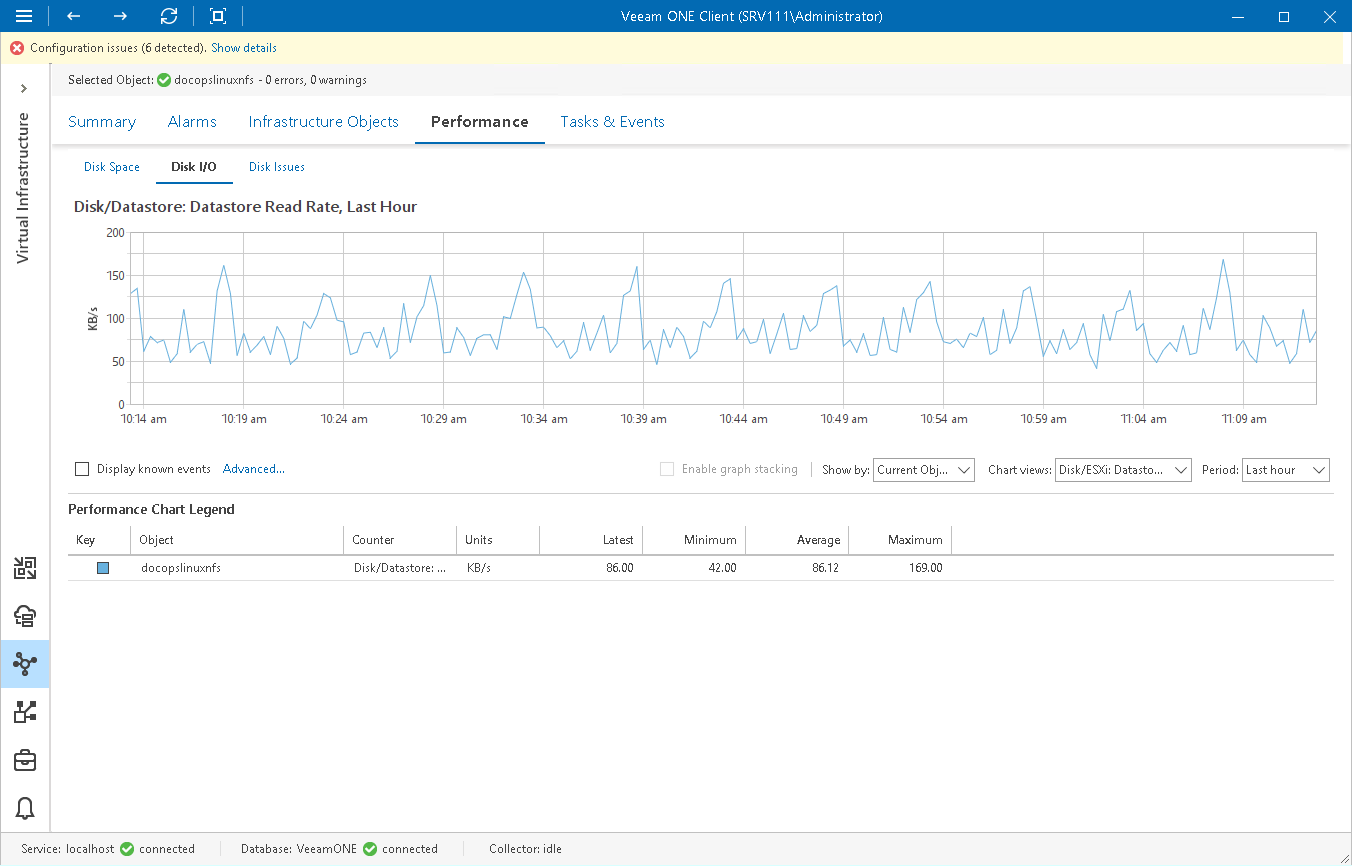
Use the Chart options list to display graphs for the current object (for example, a specific datastore or a virtual infrastructure container), for VMs or for hosts that work with the selected datastore. For VMs or for hosts, this chart displays stacked graphs to let you see actual cumulative load on a particular datastore. If you choose to view the chart for the top Datastore parent object, you will also be able to stack graphs by all available datastores.
The following table provides information on predefined views and counters.
Chart View | Measurement Unit | Description |
Disk/ESXi: Datastore Read Rate | B/s | Rate at which data is read from the datastore. |
Disk/ESXi: Datastore Write Rate | B/s | Rate at which data is written to the datastore. |
Disk/ESXi: Datastore Usage | B/s | Sum of read and write rates to the datastore. |
Disk/ESXi: Datastore Read I/O | Number | Number of times data was read from the disk by all VMs residing on the datastore. |
Disk/ESXi: Datastore Write I/O | Number | Number of times data was written to the disk by all VMs residing on the datastore. |
Disk/ESXi: Datastore I/O | Number | Average number of commands issued per second to the storage device by the adapter. |
Disk/ESXi: Datastore Read Latency | Seconds | Average amount of time taken to a read operation from the datastore (from the perspective of an ESX(i) host). |
Disk/ESXi: Datastore Write Latency | Seconds | Average amount of time taken for a write operation to the datastore (from the perspective of an ESX(i) host). |