Report Output
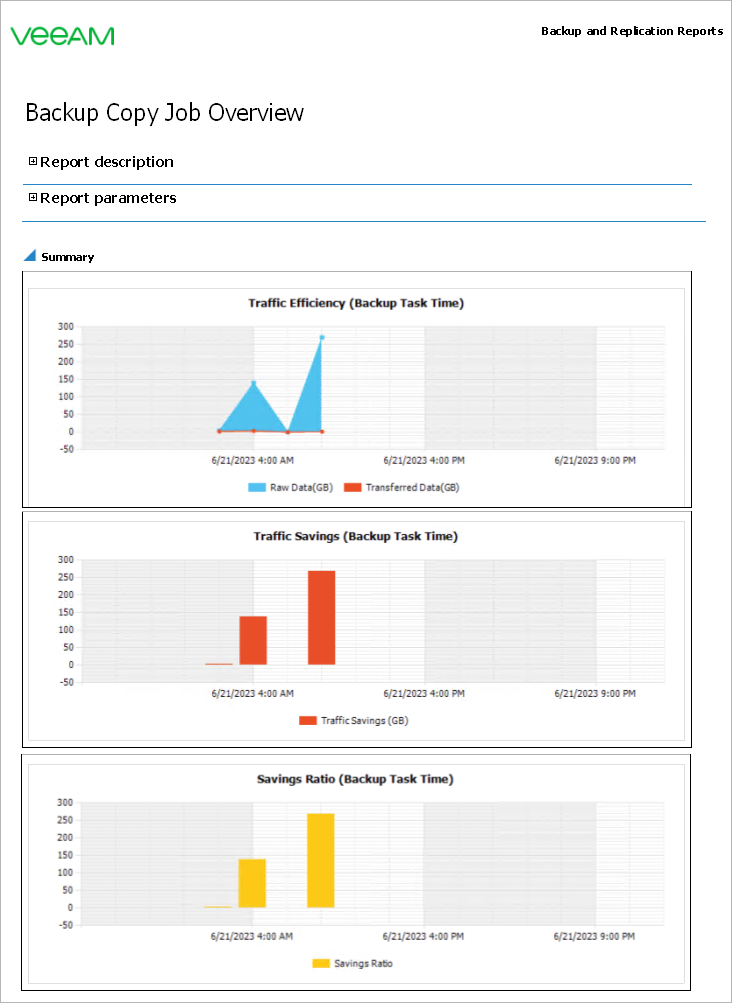
The Summary charts will display total day-by-day traffic usage history:
- The Traffic Efficiency (GB) chart will show the actual amount of traffic read from the source repository and the amount of traffic transmitted over the network to the target repository
- The Traffic Savings by Day (GB) chart will show the amount of traffic saved on each day of the reporting interval (that is, the difference between the amount of read traffic and the amount of transferred traffic)
The Accelerator Details table will provide the following information for each pair of WAN accelerators used by backup copy jobs.
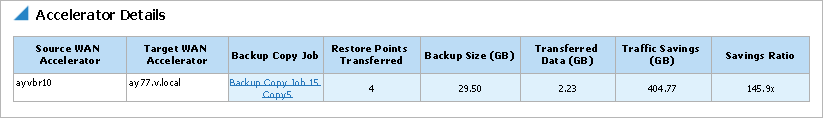
In this example, the report shows that during this week there were 6 restore points transferred, total amount of transferred data was 7.9 GB and traffic savings ran up to 23.34 GB.
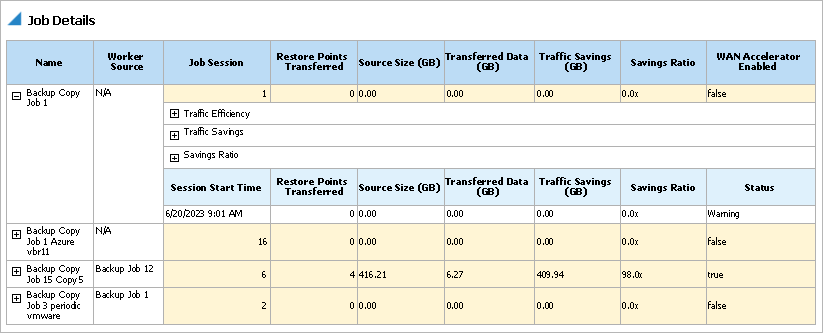
The Job Details table will provide detailed information on job sessions, worker source job, restore points transferred by the pair of WAN accelerators, original backup file sizes (in GB), actual amount of data transferred (in GB) and the amount of saved traffic (in GB).