Report Output
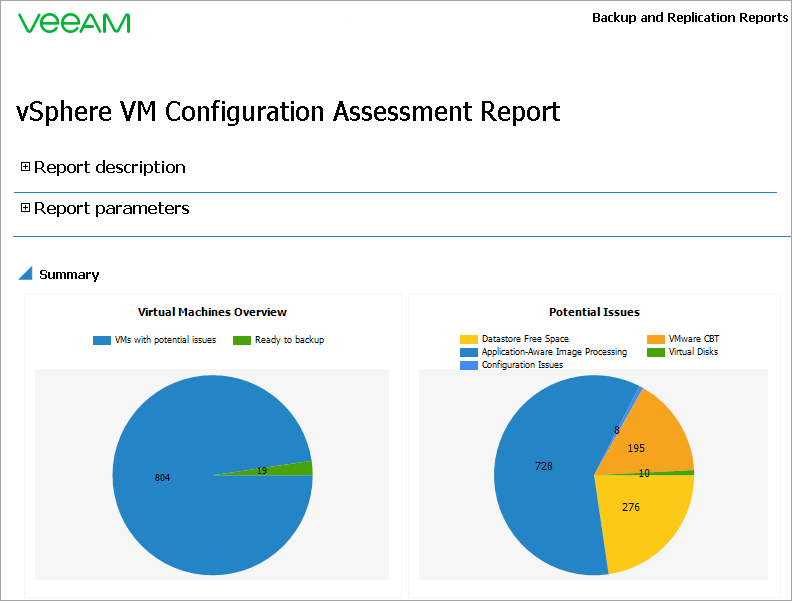
In the Summary pie charts will show the following information:
- The Virtual Machines Overview chart will display total number of VMs with potential issues and total number of VMs ready for backup.
- The Potential Issues chart will display the number of VMs with Application-Aware Image Processing, Datastore Free Space, Virtual Disks, VMware CBT and Configuration issues described in the Summary section.
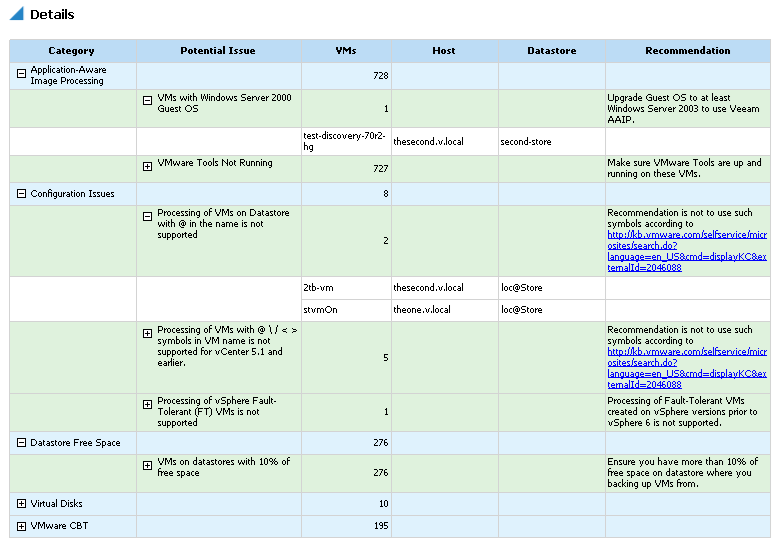
The details table will provide details and recommendations for each VM issue.