Morning Coffee Dashboard
The _Morning Coffee Dashboard is the first thing to see once you get to work. This dashboard provides at-a-glance real-time overview of your infrastructure.
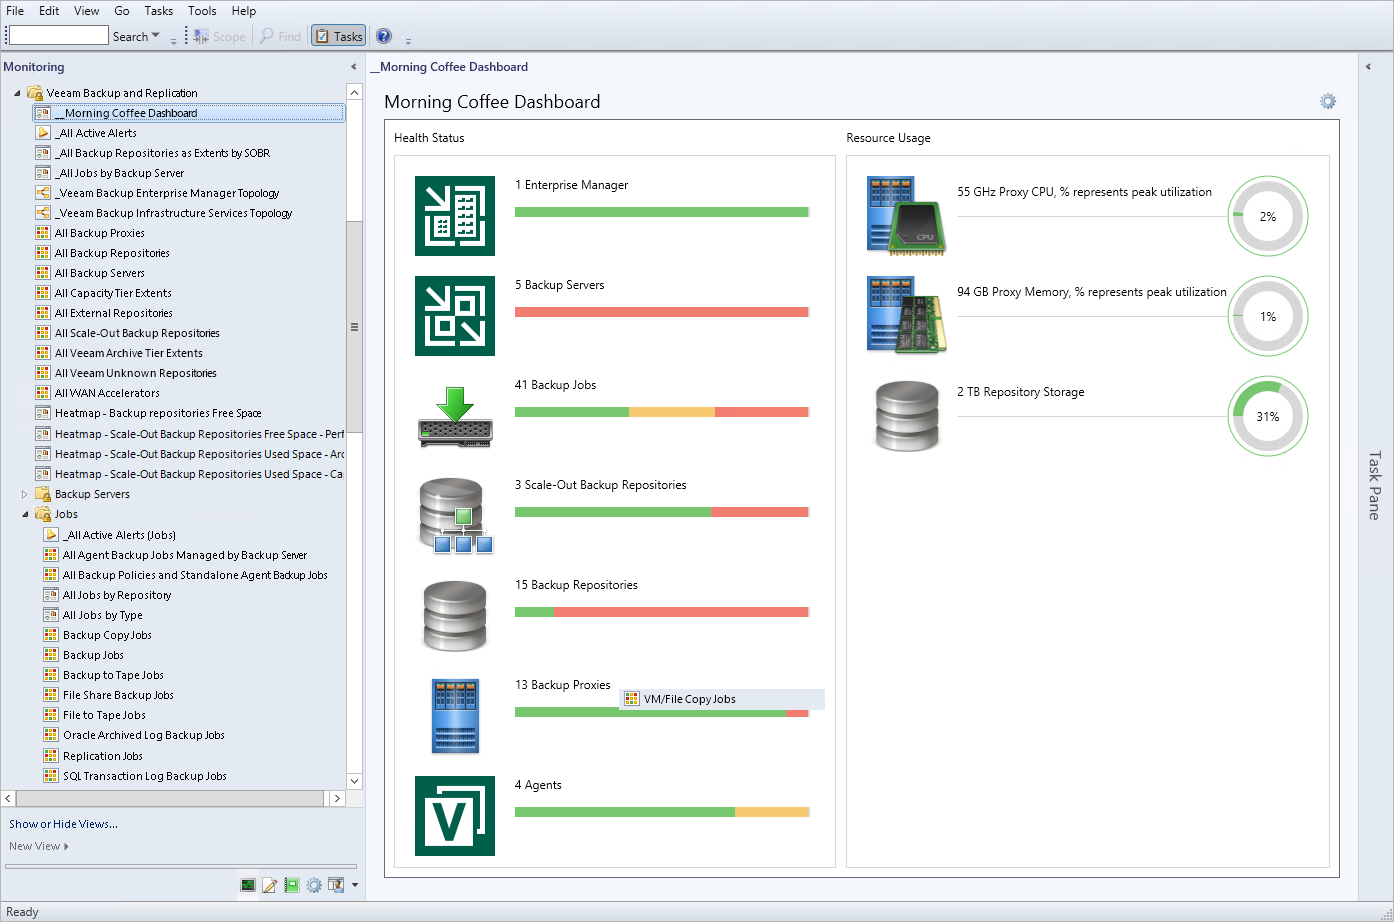
The dashboard tracks the state of Veeam Backup Enterprise Manager servers (if present), Veeam Backup & Replication servers, Veeam scale-out backup repositories, backup repositories, backup proxies, all configured jobs, computers protected by Veeam Agent for Microsoft Windows (further referred to as Veeam backup agents), storage and the overall resource utilization, and immediately displays these changes in a single view. The _Morning Coffee Dashboard is available in the root Veeam Backup and Replication folder.
The Health Status pane shows discovered groups of backup infrastructure objects and the total number of objects in each group. For each group, the pane also displays a colored bar whose cells represent current health state of objects in that group:
- Green: an object is in the Healthy state;
- Yellow: an object is in the Warning state;
- Red: an object is in the Critical state.
The Resource Usage pane shows total amount of resources in the discovered backup infrastructure and displays current resource usage (in percentage) as colored pie charts. Colors on the charts depend on whether resource usage thresholds are breached.
The default configuration of the Morning Coffee widget can be customized. For details on changing widget settings, see section Personalizing Morning Coffee Widget.