Report Output
The Alerts by Severity per Day chart will show the number of alerts raised for each day of the week. The chart bars will illustrate how many Warning and Critical alerts were raised.
The Alerts by Priority per Day chart will show the number of alerts raised for each day of the week.
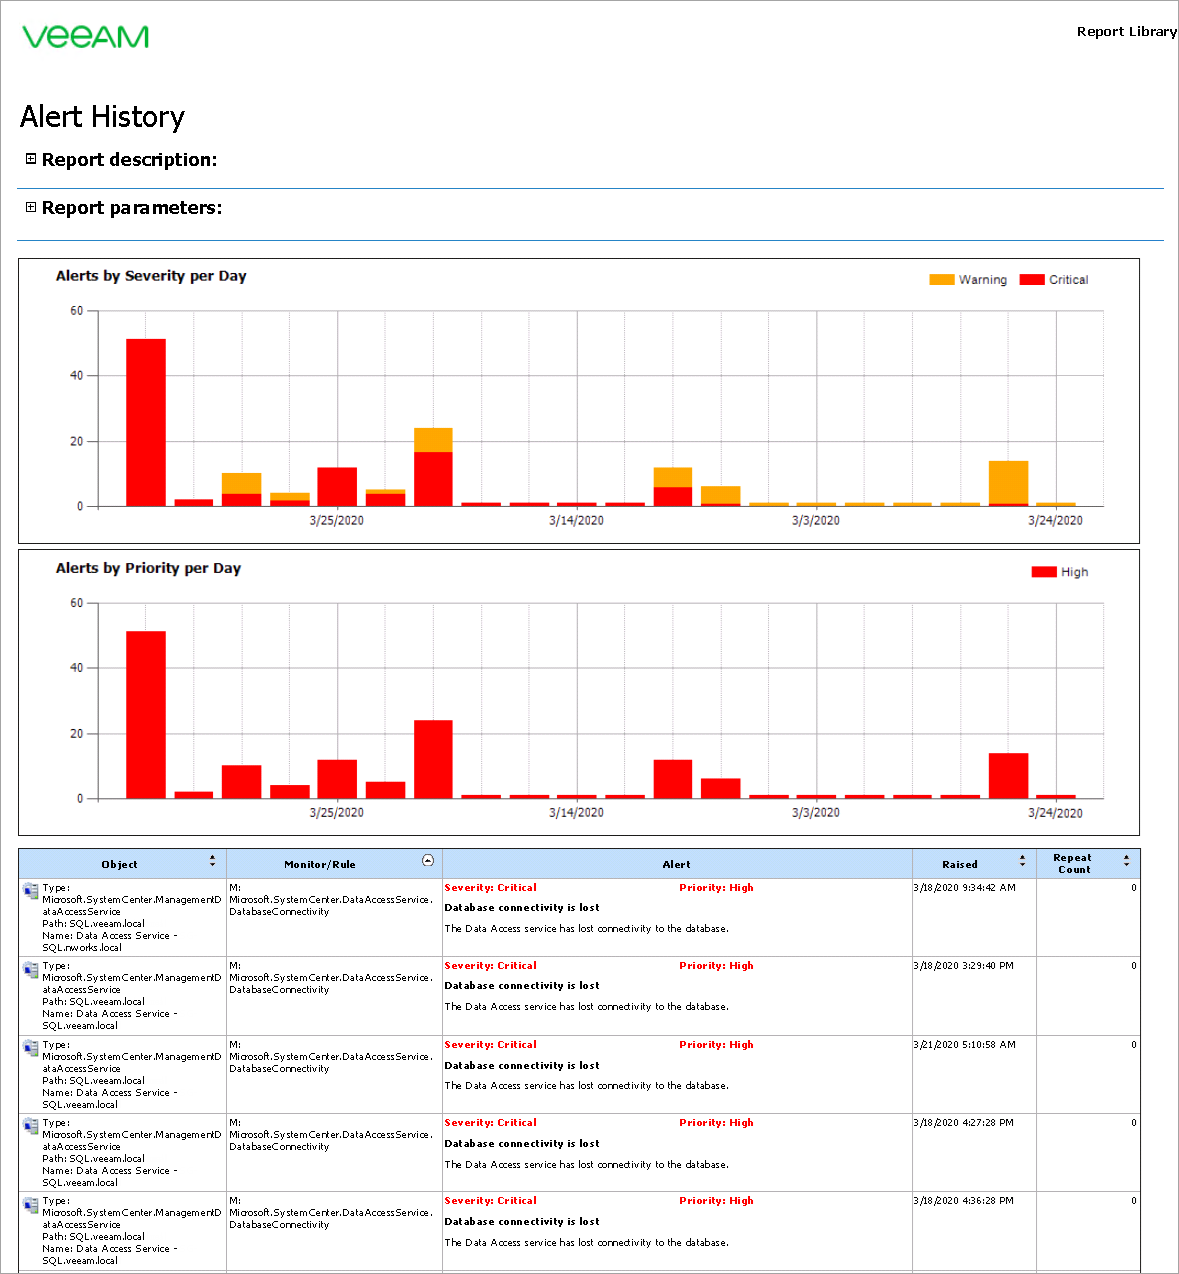
The report table will detail alert information:
Column | Description |
Object | Name of the infrastructure object that caused alerts. |
Monitor/Rule | Name of a monitor or rule that triggered alerts. |
Alert | Severity level, priority level and description of an alert. |
Raised | The date and time when the alert was triggered last. |
Repeat Count | Number of times that the alert was repeated. |