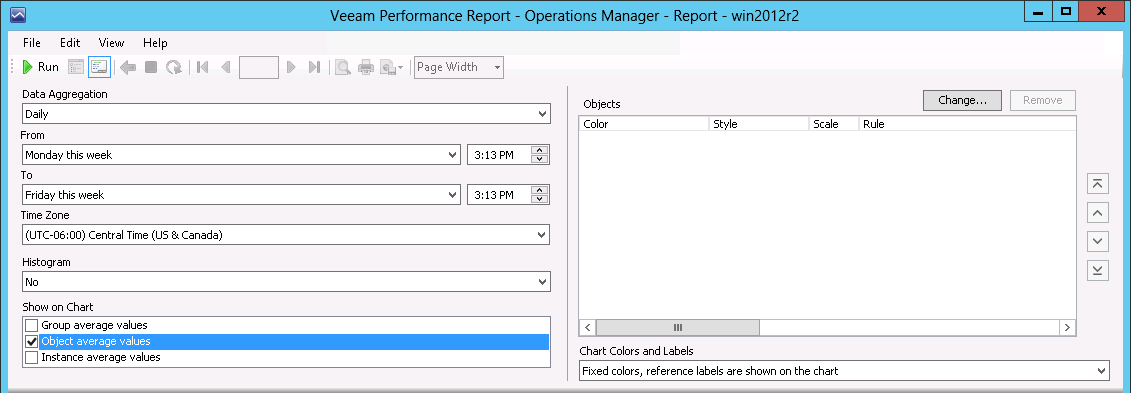
Step 5. Choose Values to Show on Chart
Next, choose what types of values will be displayed as series on the chart. We will choose to show only object average values — so, every series will represent how the amount of free space of a specific log file was changing.