Report Output
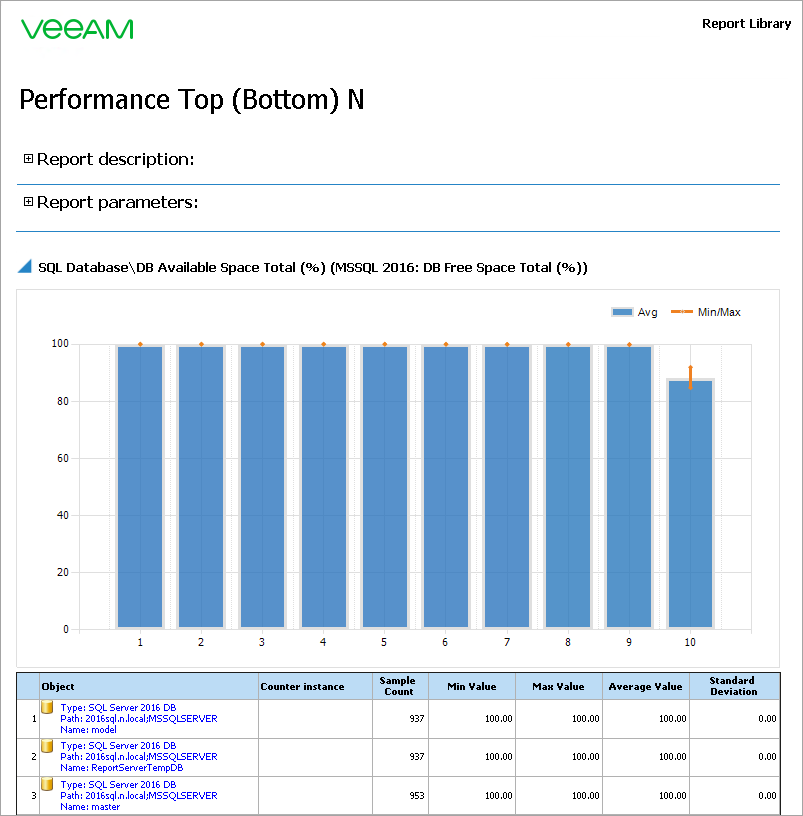
The report includes a chart and a table. The chart shows columns for every database starting at 0 to the average value (the average percentage of free space). For every object, the chart also shows a range of values from the minimum value to the maximum.
The table shows additional details for every database: database name, sample count, minimum, maximum and average free space values, as well as the standard deviation.
|
If several objects have the same ranking function value, the report will include more objects than you have set in the Count field. For example, the “bottom 10” report will show 11 objects if two objects “share” the same position (have the same ranking). |
If you need to investigate performance issues for a specific object, you can drill down to the Veeam Performance Details Report by clicking a column on the chart or using links in the Object column in the table.