Report Output
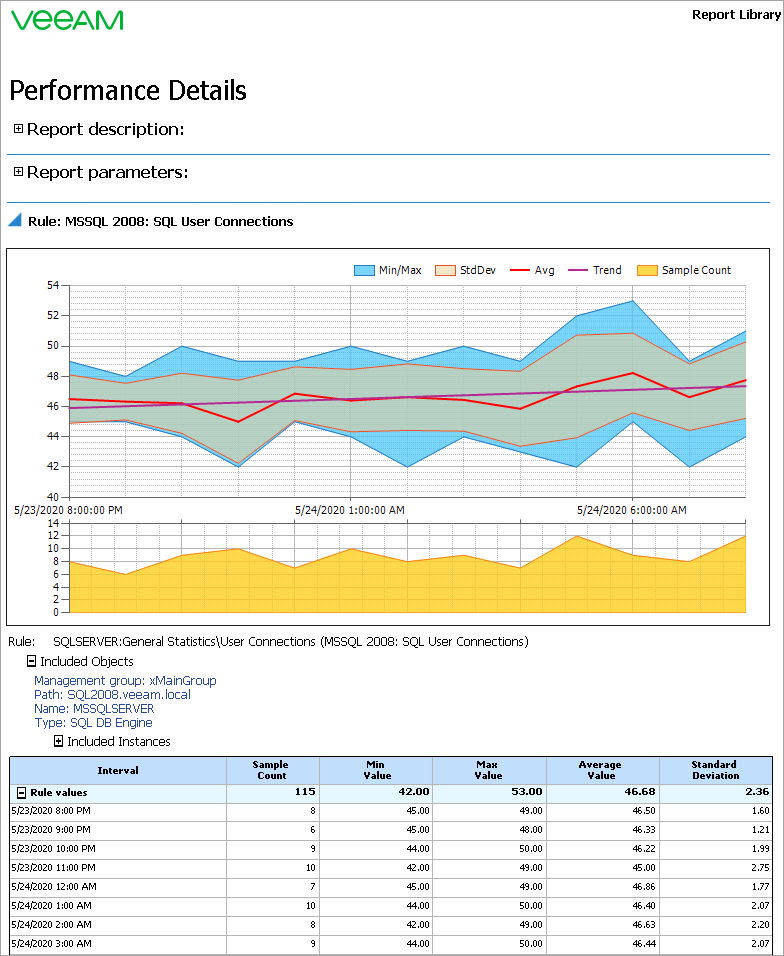
The report will detail how the number of user connections to the SQL Server has changed during the day.
The chart will include separate series for minimum, maximum, average number of user connections, standard deviation and trend. The table will show the following values for every hour: sample count, average, minimum and maximum and standard deviation values.