Report Output
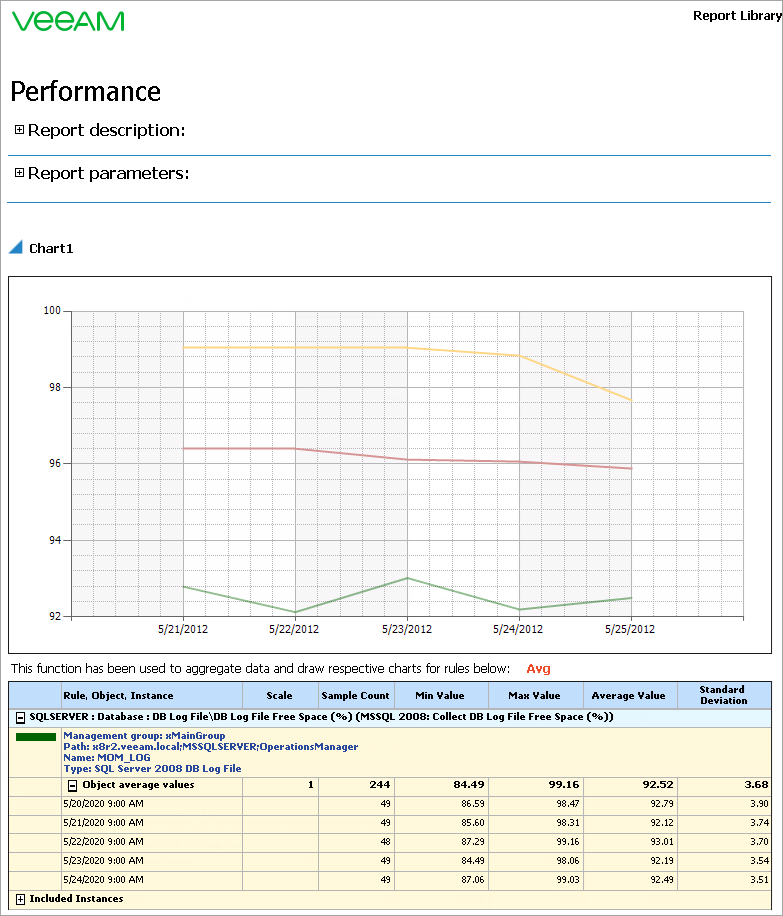
The report will show how the amount of free space in transaction log files was changing during the specified time interval.
The chart will display a separate series for each log file. The table will detail daily values of the log file free space (sample count, average, minimum and maximum and standard deviation values).
You can click performance rules in the output table to drill down to the Veeam Performance Details Report.