Report Output
The report will show rules and monitors that triggered alerts and compare the alerting activity for selected time intervals. You can expand table rows to view objects that caused the alerts and the alerting activity for every object.
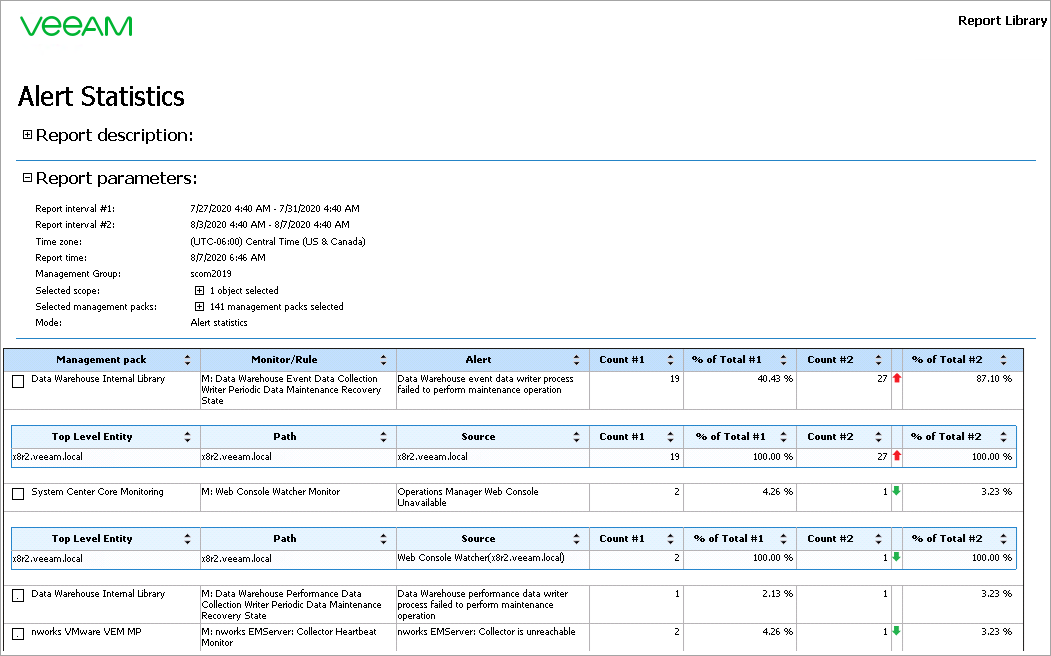
The following table describes report data in detail.
Column | Description |
Top Level | |
Management Pack | Management pack from which alerts originate. |
Monitor/Rule | Name of a monitor or rule that triggered alerts. |
Alert | Name of the alert. |
Count #1 | Number of times the alert was raised for the first time interval. |
% of Total #1 | Alert share for the first time interval (relative to the number of all alerts included in the report). |
Count #2 | Number of times the alert was raised for the second time interval. The arrows show if the alert quantity (Count) has decreased (green arrow), increased (red arrow) or stayed the same (blue equality symbol) during the second interval in comparison with the first one. |
% of Total #2 | Alert share for the second time interval (relative to the number of all alerts included in the report). |
Details Level | |
Top Level Entity | Parent entity of the object that caused the alerts. |
Path | Path to the object that caused alerts. |
Source | Name of the object that caused alerts. |
Count #1 | Number of alerts raised for the object for the first time interval. |
% of Total #1 | Alert share for the first time interval (relative to all alerts included into report). |
Count #2 | Number of alerts raised for the object for the second time interval. The arrows show if the alert quantity (Count) has decreased (green arrow) or increased (red arrow) during the second interval in comparison with the first interval. |
% of Total #2 | Alert share for the second time interval (relative to all alerts included into report). |
You can also click a number in the Count #1 and Count #2 columns of the output table to drill down to the Veeam Alert History Report.