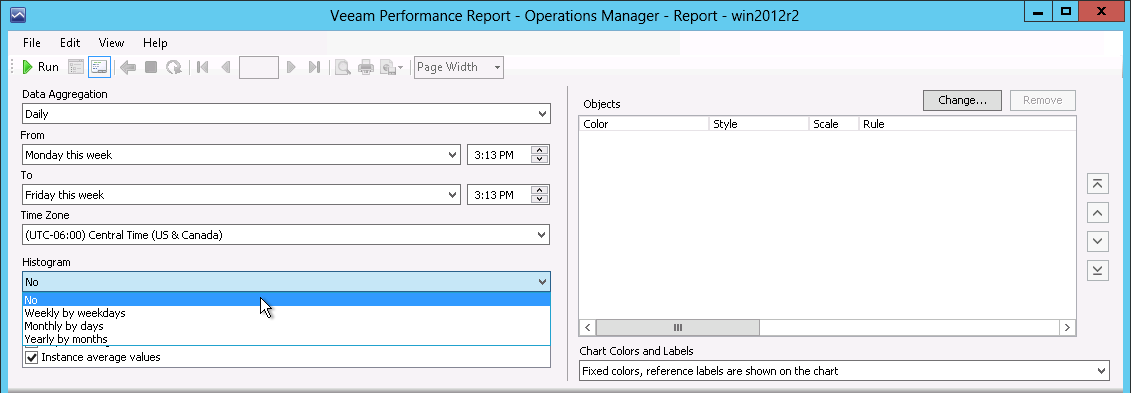
Step 4. Define Chart Display Options From the Histogram list, choose what type of values will be displayed on the x-axis of the report chart.