 This is an archive version of the document. To get the most up-to-date information, see the current version.
Morning Coffee Dashboard
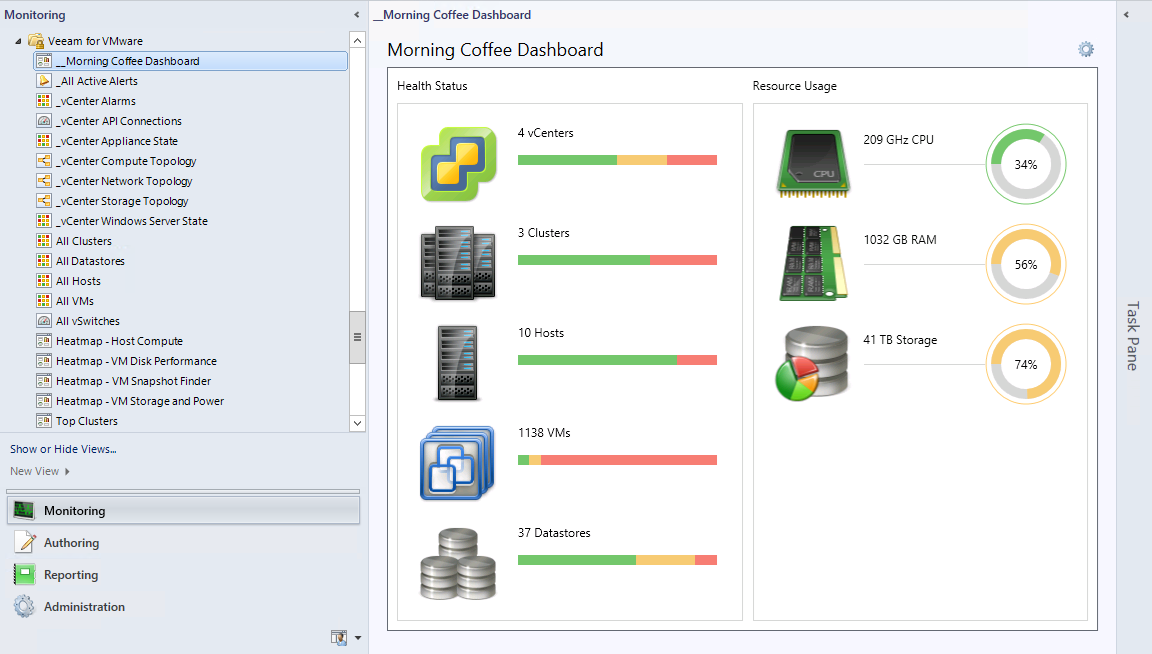
The _Morning Coffee Dashboard® is the first thing to see once you get to work. This dashboard provides at-a-glance real-time overview of your infrastructure.
The dashboard tracks the state of vCenter Servers, physical hosts, clusters, VMs, storage and the overall resource utilization, and immediately displays these changes in a single view.
The Morning Coffee Dashboard is available in the root Veeam for VMware folder.
The Health Status pane shows discovered groups of virtual infrastructure objects and the total number of objects in each group. For each group, the pane also displays a colored bar whose cells represent current health state of objects in that group:
- Green: an object is in the ‘Healthy’ state;
- Yellow: an object is in the ‘Warning’ state;
- Red: an object is in the ‘Critical’ state.
The Resource Usage pane shows total amount of resources in the discovered virtual infrastructure and displays current resource usage (in percentage) as colored pie charts. Colors on the charts depend on whether resource usage thresholds are breached.
The default configuration of the Morning Coffee widget can be customized. For details on changing widget settings, see section Personalizing Veeam Dashboard Widgets.